The Canadian Technician December 22, 2011 at 02:24 PM
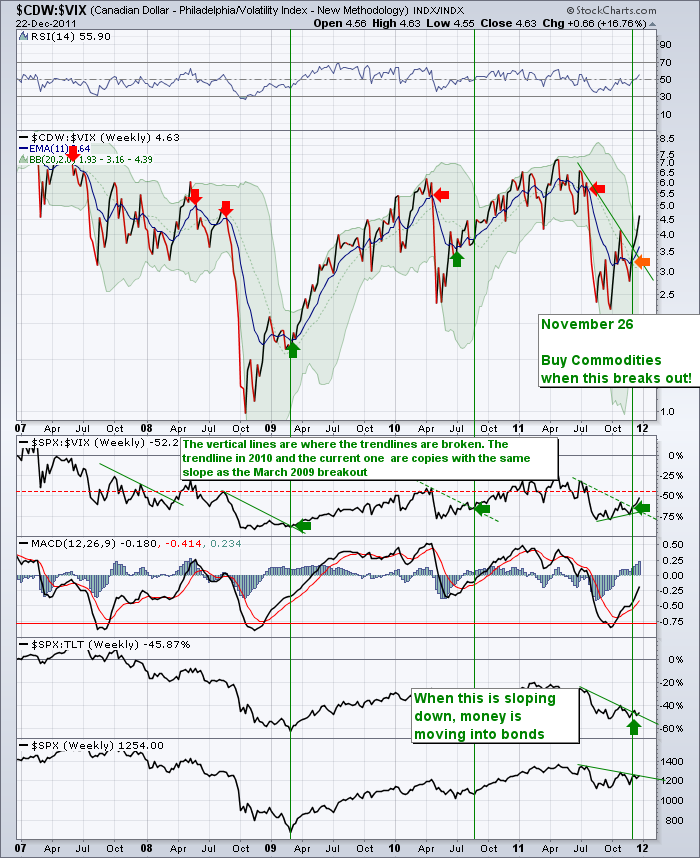
Sometimes Brevity makes a point. We'll try that tonight in one chart. A weekly chart. 4 years of data. Let's examine the chart. Notice the top price box which is the Cdn $ ratio to the vix. When the Loonie outperforms the VIX, it is time to get long commodities... Read More
The Canadian Technician December 21, 2011 at 02:16 PM
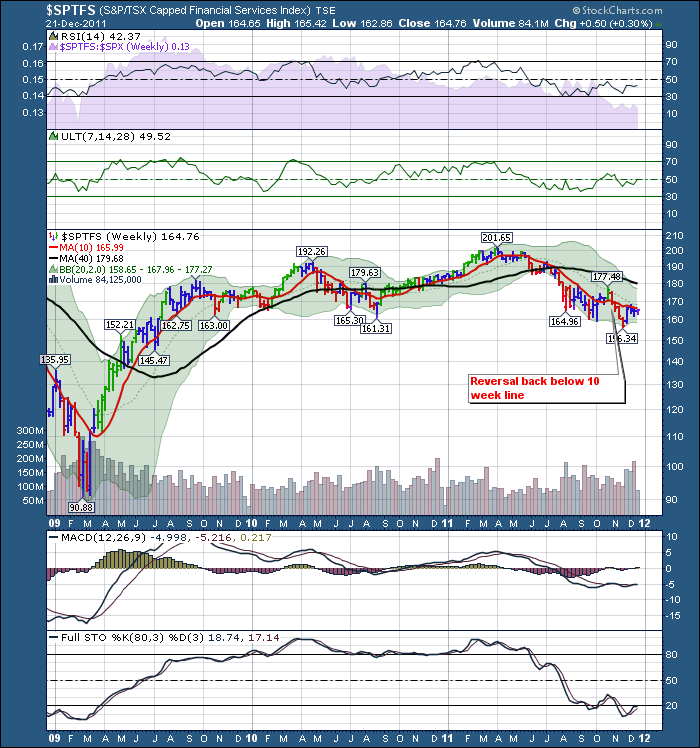
Let's check the dashboards for the banking sector to see if things are improving yet. Here is the Canadian Financial sector The MACD has a histogram just pushing above the zero line. That's promising. The Full sto's are trying to come out of oversold... Read More
The Canadian Technician December 21, 2011 at 06:10 AM
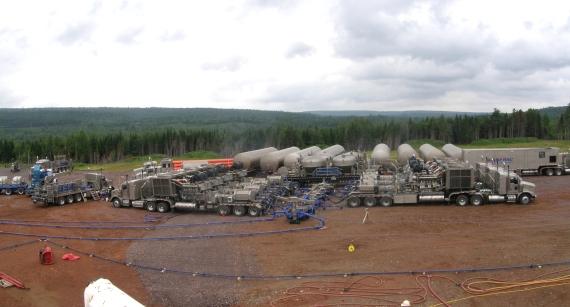
Alberta is a hotbed for oilfield service companies. Today, it was a hotbed for investors. Let's briefly describe what an oilfield service company does. Nothing in the industry happens without them... Read More
The Canadian Technician December 19, 2011 at 02:51 PM
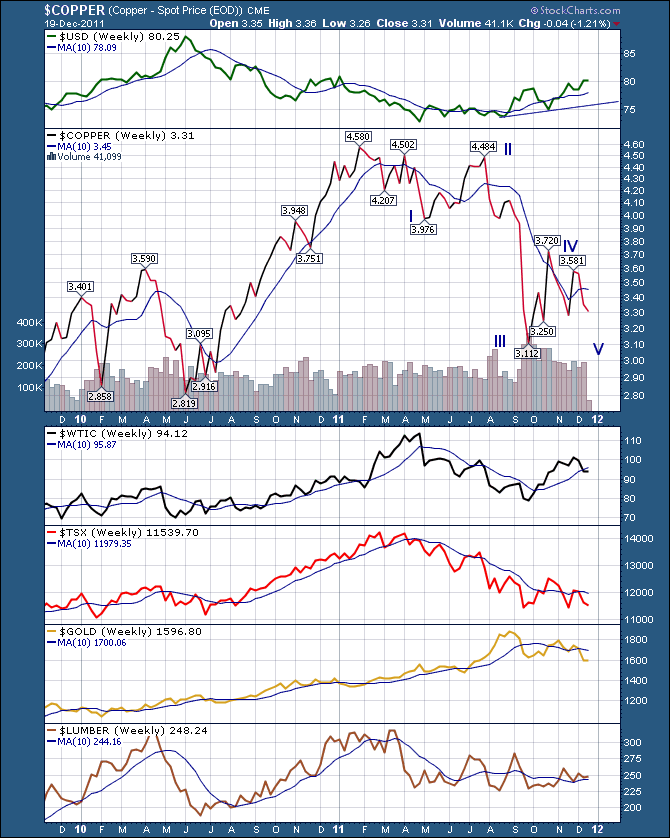
Here is a brief Commodities dashboard. While we all study Oil and Gas, $WTIC has a nice upslope. I am also interested in the coiling on the board lumber chart. We currently have four higher lows , and two lower tops. It is also still above the 10 week MA... Read More
The Canadian Technician December 16, 2011 at 01:33 PM
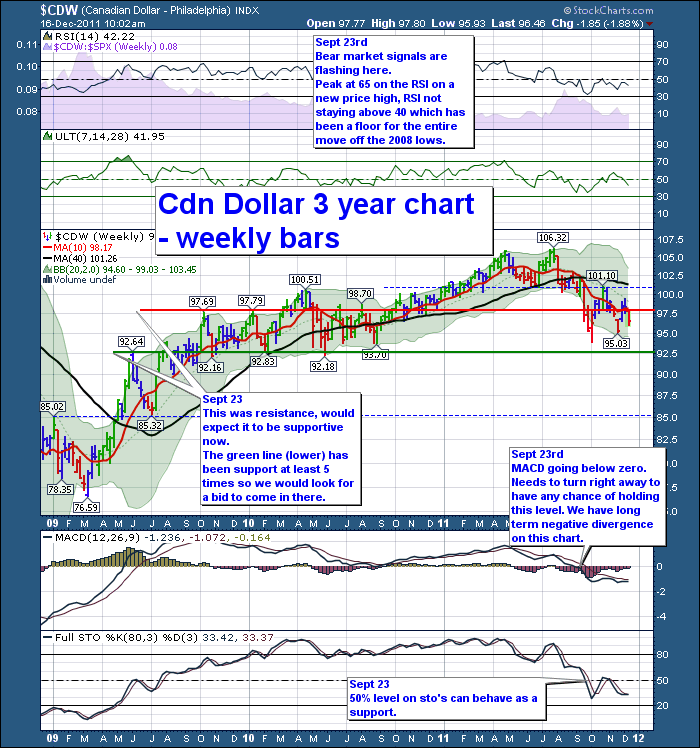
The Canadian dollar is a strong tracker of $WTIC. If oil pulls back here, the Canadian dollar could as well. This top chart does not have the Fibonacci levels. The one below does. You can see how the Fib levels help you find other areas of support on the chart... Read More
The Canadian Technician December 15, 2011 at 07:47 AM
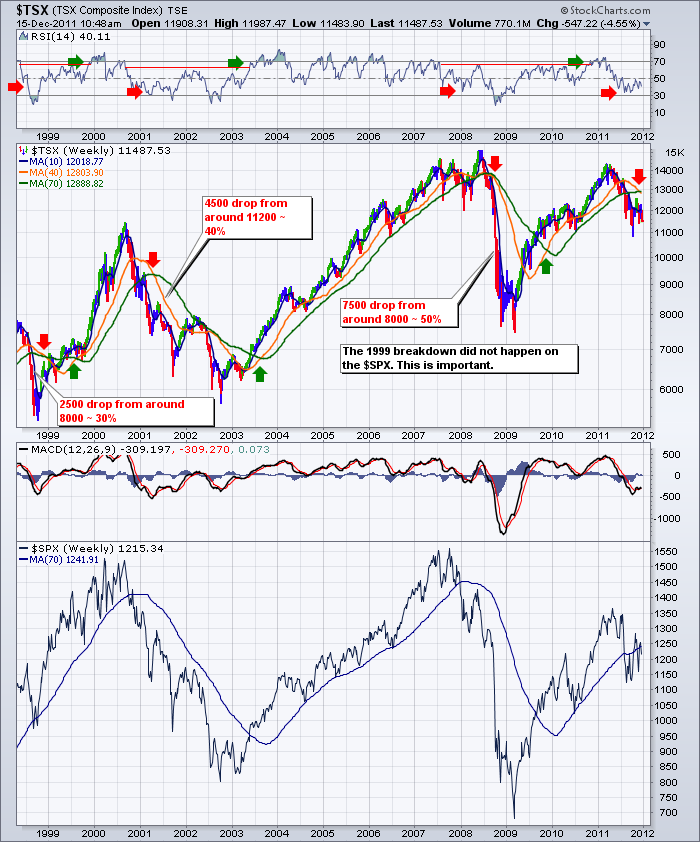
We had a significant marker happen this week. Let's look at how to deal with it. First of all, here is a chart going back almost 14 years. Notice how significant it is when the 40 week crosses below the 70 week... Read More
The Canadian Technician December 13, 2011 at 08:45 AM
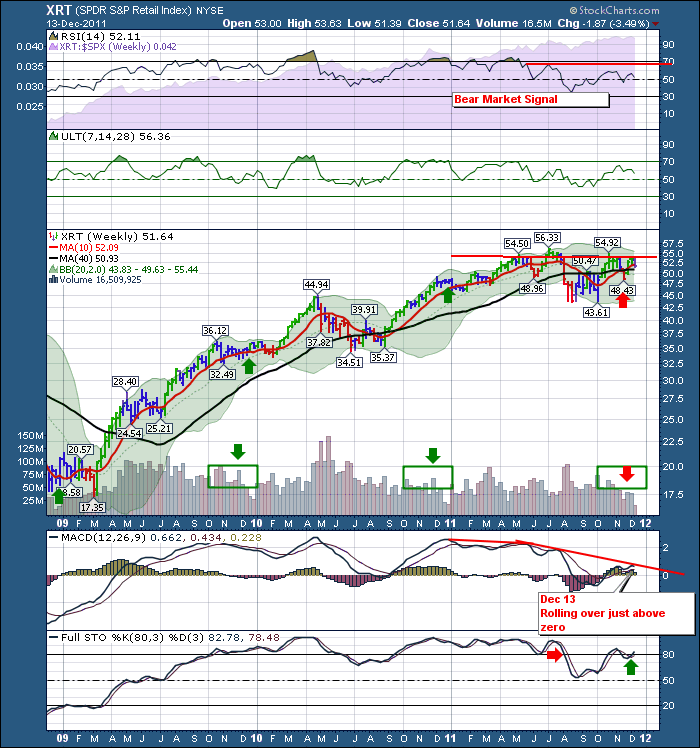
Time to do a little detail in retail.... First of all, why are we on this subject? It's not big in Canada, but if retail is slowing we should be very aware. If retail is slowing before Christmas....there is gonna be a few growth stocks giving up some P/E... Read More
The Canadian Technician December 12, 2011 at 02:42 PM
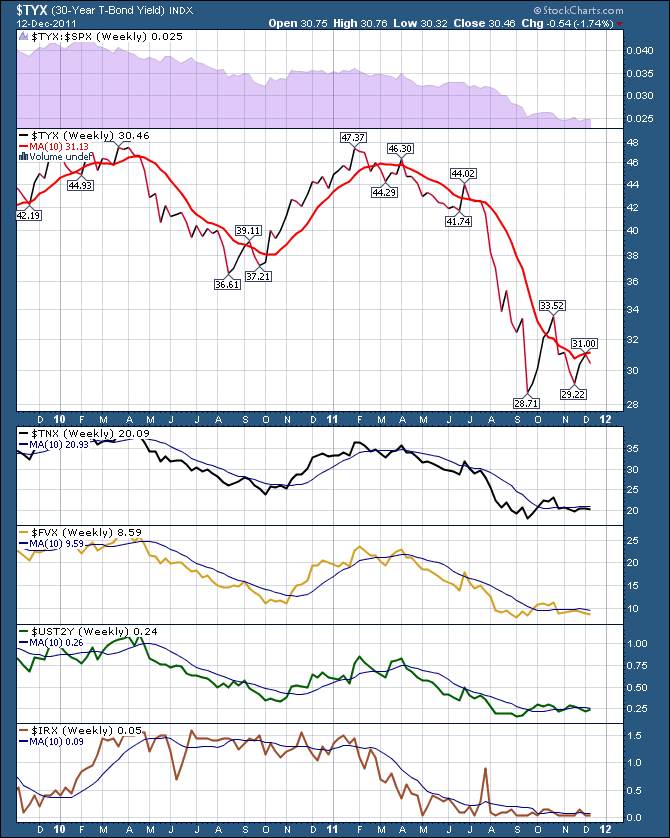
Just a quick note tonight about bonds in this crucial time. 30 year, 10,5,2 year and the 3 month $IRX. Everything is still trading under the 10 week. On the two previous Euro Summits the $IRX - 3 Month Yield chart would rally briefly... Read More
The Canadian Technician December 11, 2011 at 02:22 PM
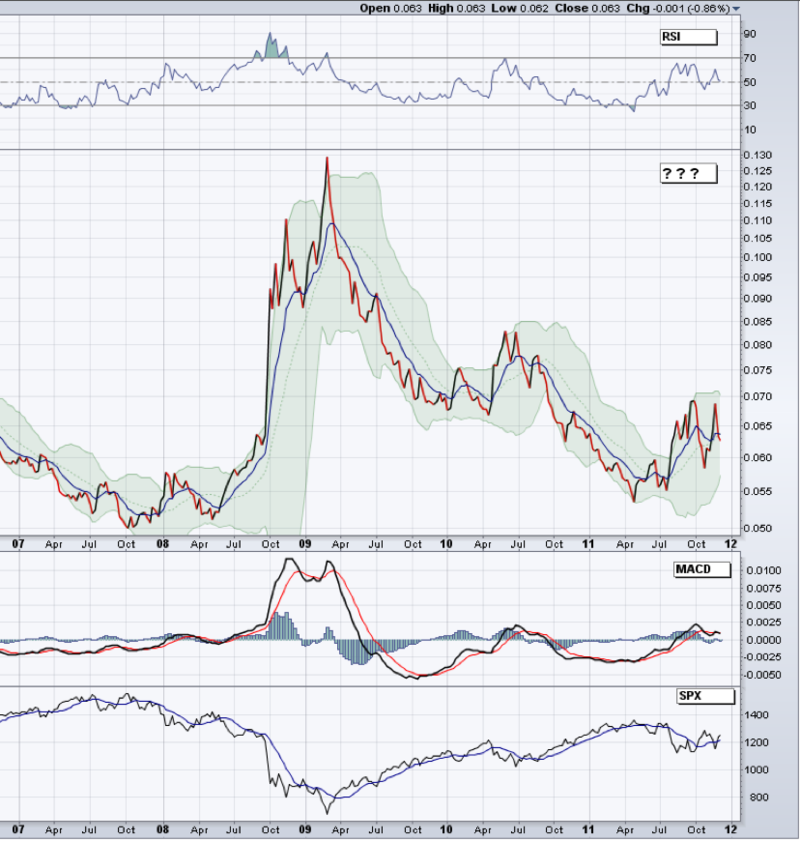
Well in a market that has 2% oscillations for breakfast, sometimes a step back can help. Today I have posted a mystery chart. This chart was given to me on October 4th by one of the CSTA members. What is it a chart of? Well that's a blank canvas... Read More
The Canadian Technician December 08, 2011 at 09:51 AM
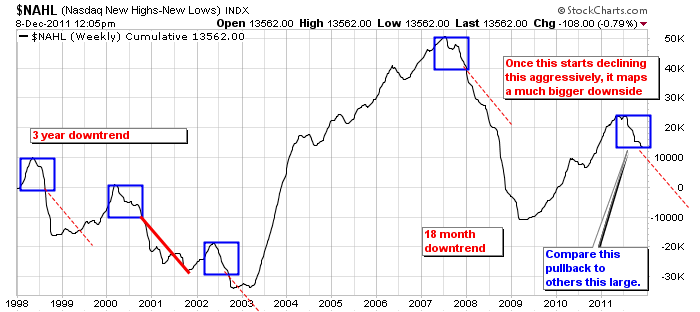
If stocks are making new highs, that is pretty important. If stocks are making new lows, that is even more important. When you keep track of the highs minus the lows an interesting trendline is created . Stockcharts does a great job of publishing these... Read More
The Canadian Technician December 07, 2011 at 03:17 PM
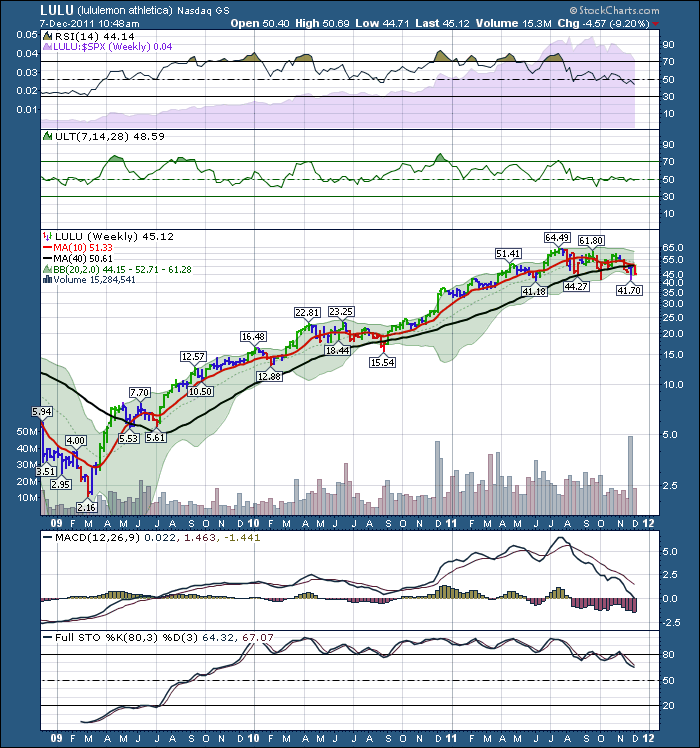
This will be a longer post. You might need a coffee! Here is LULU Weekly. Hummm, this chart needs a little annotation. We need a little background information. How do great stocks signal their final top? Lets take some random examples... Read More
The Canadian Technician December 06, 2011 at 10:49 AM
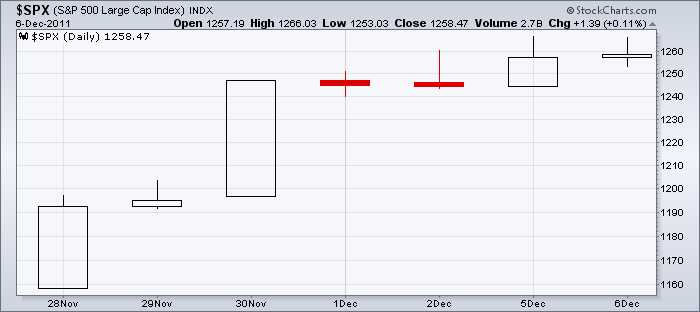
Here is the $SPX chart since the low of November 28th. The SPX has moved exactly 100 points from November 27th close to December 6th close. 89 points of the 100 points happened in the premarket if you include the first 5 minute candle of each day while the market opened... Read More
The Canadian Technician December 05, 2011 at 09:42 AM
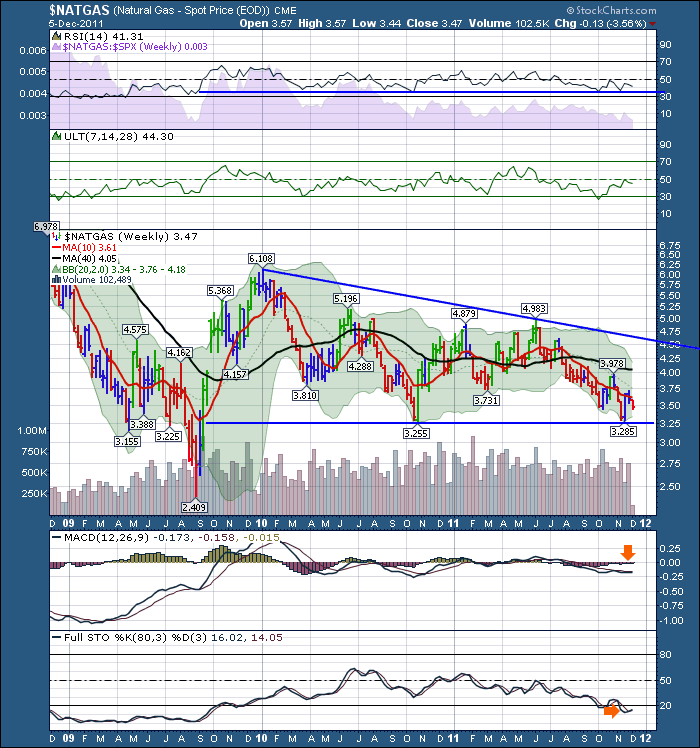
Here is the Weekly for $NATGAS. Definitely at a place on a chart to look for an upside reversal. Bouncing off the 2 year low trendline. Here is the Daily. Here is our dashboard for the $NATGAS sector. Encana is still struggling below the 10 week... Read More
The Canadian Technician December 01, 2011 at 01:54 PM
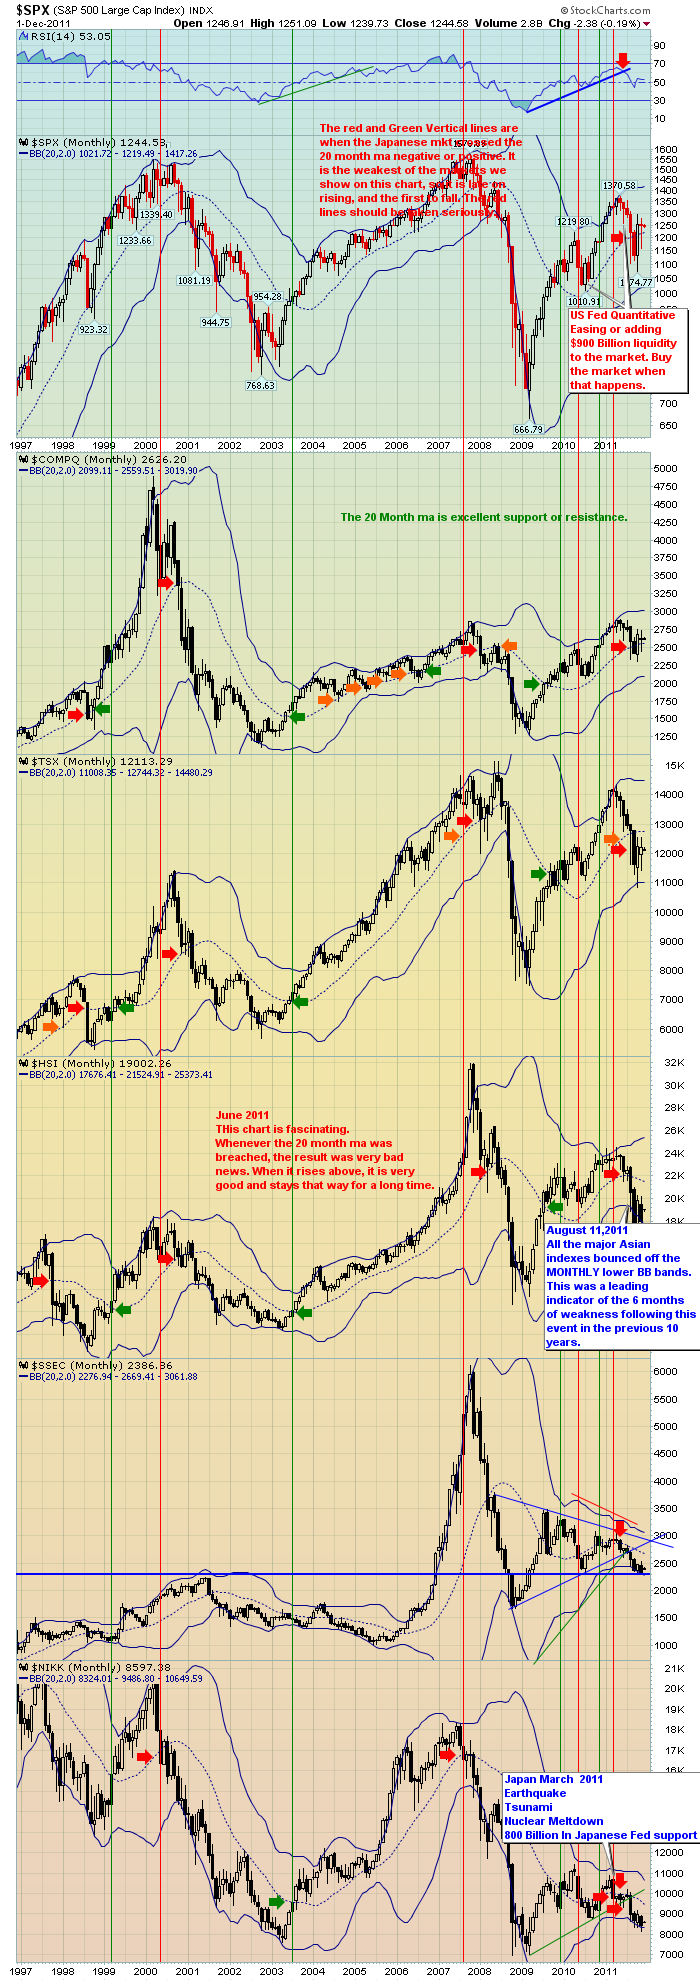
In three simple charts we can get a feel for the global picture. Well, the SPX spent a month getting back to where it finished last month. All other global markets on the above chart finished in the lower half of the monthly Bollinger Bands (BB)... Read More