The Canadian Technician March 30, 2016 at 02:20 PM
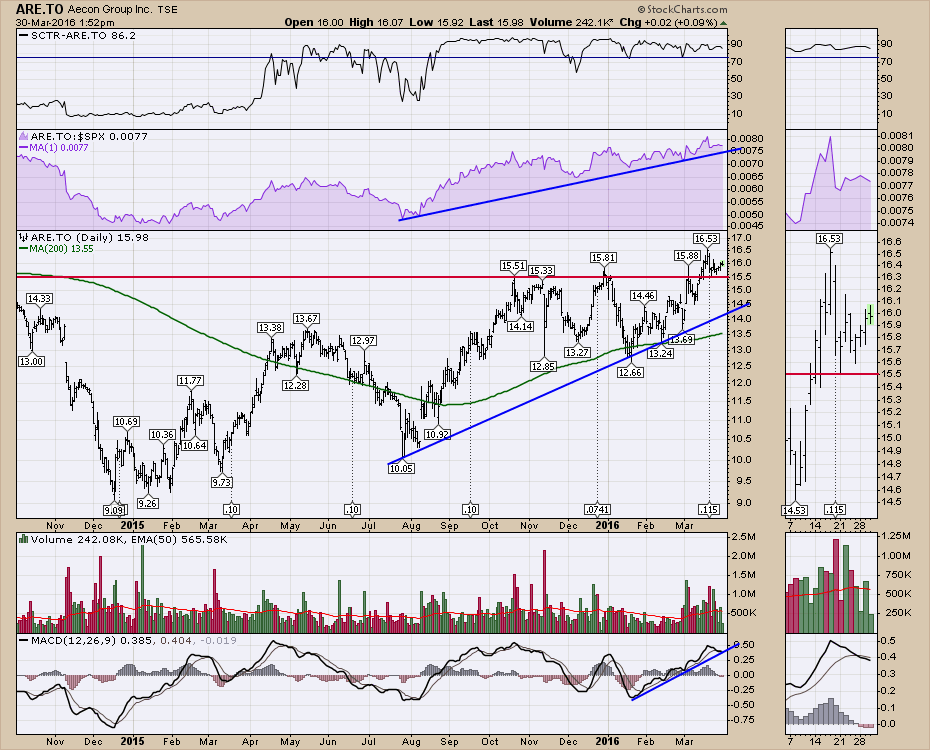
With the market recently surging, it is difficult to be bearish when the US Market makes higher highs. The $TSX made its highs on March 17th while oil made its high on March 18th, first thing in the morning. We've traded between 13650 and 13250 since... Read More
The Canadian Technician March 24, 2016 at 09:45 AM
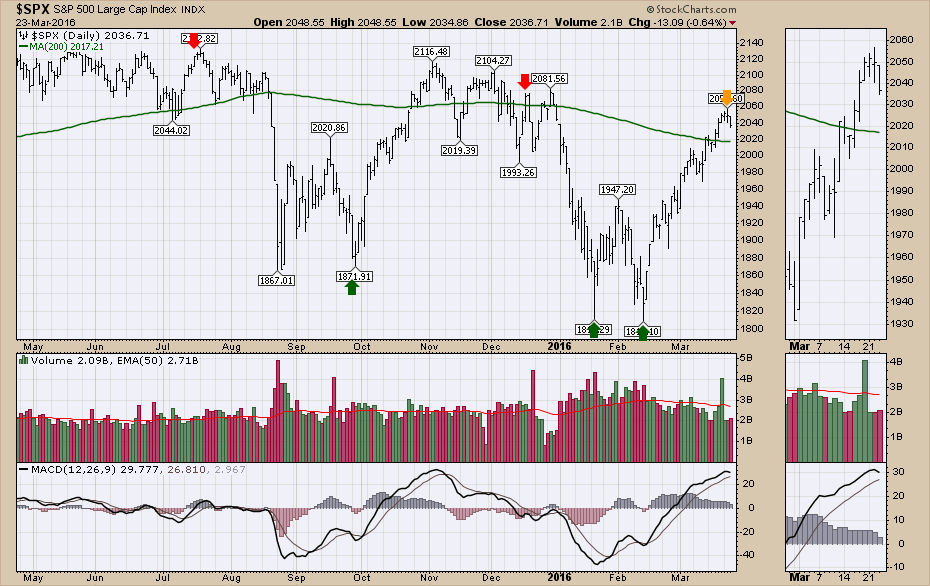
During The Canadian Technician 20160322 Webinar, I covered off some of the signals that were leaning to a new bull market. While I am still in bear camp mode, I did discuss some powerful charts that suggest a transition to a new bull market is very close... Read More
The Canadian Technician March 16, 2016 at 10:29 AM
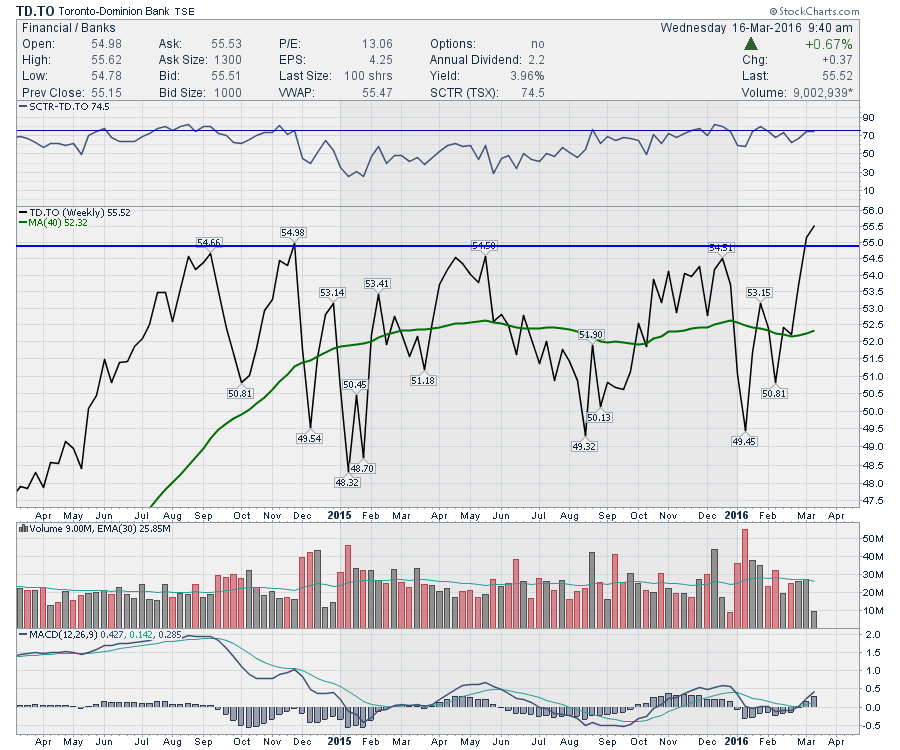
In the world of banking, the Canadian banks have been very resilient to market forces. Running through my scans today, I found the TD Bank breaking out to a new all-time high... Read More
The Canadian Technician March 09, 2016 at 01:44 PM
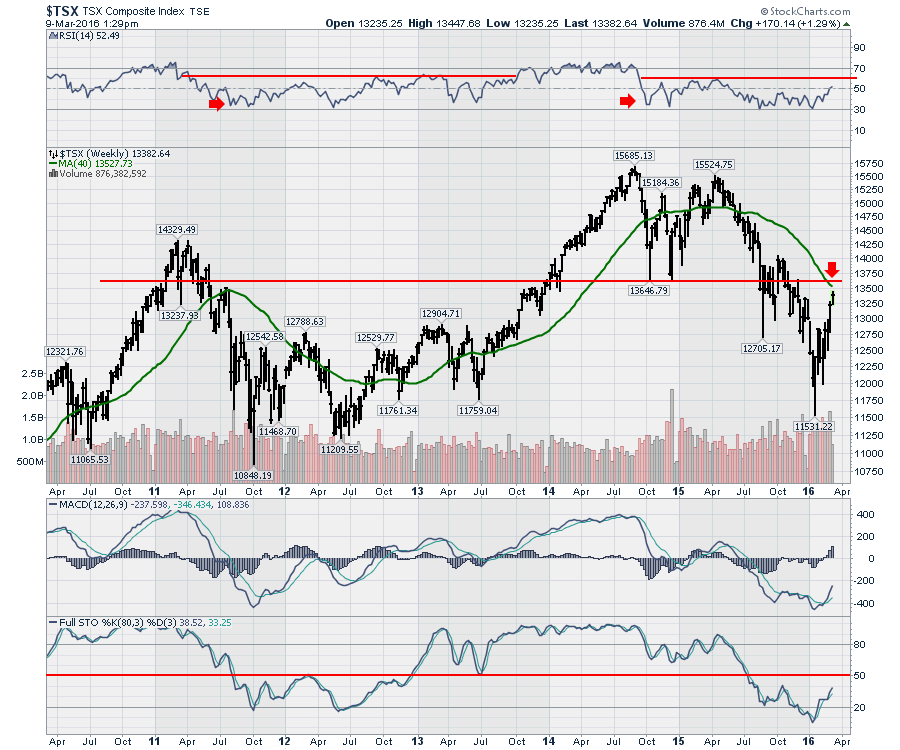
On Tuesday, during the Canadian Technician Webinar 20160308, I reviewed the various Canadian Sectors. I demonstrated the various markets using the RSI indicator on weekly charts. This generated some great questions... Read More
The Canadian Technician March 07, 2016 at 04:15 PM
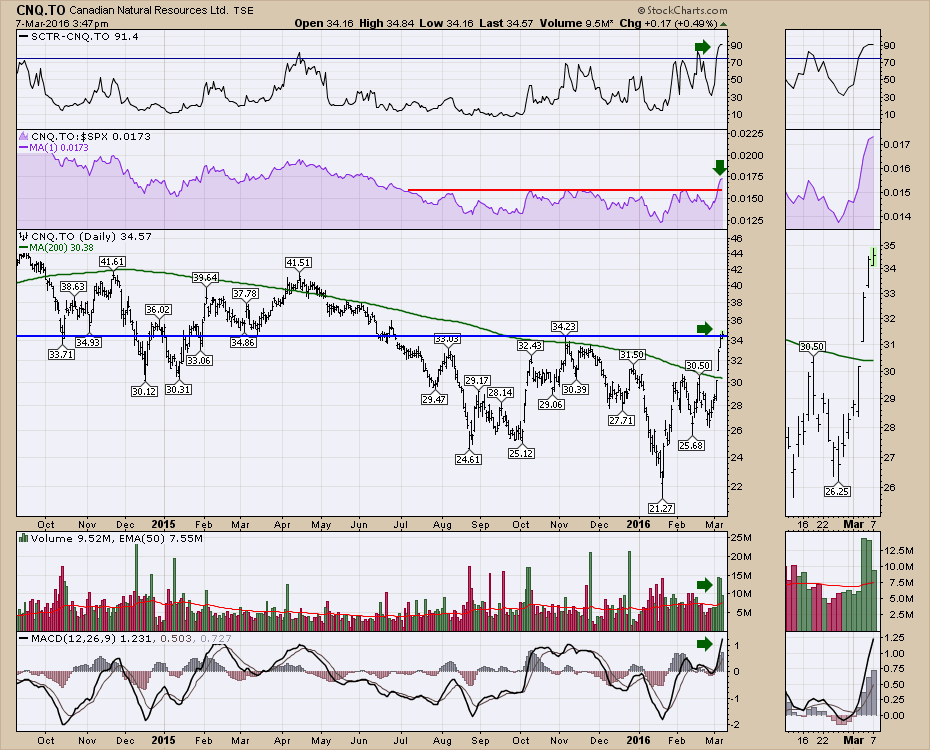
This is the moment we've all been waiting for. Stocks finally pushing back up against their 200 DMA average. Some are even breaking above. More importantly for Canadians, the Canadian oil companies are pushing up against previous-high-resistance levels... Read More
The Canadian Technician March 01, 2016 at 04:45 PM
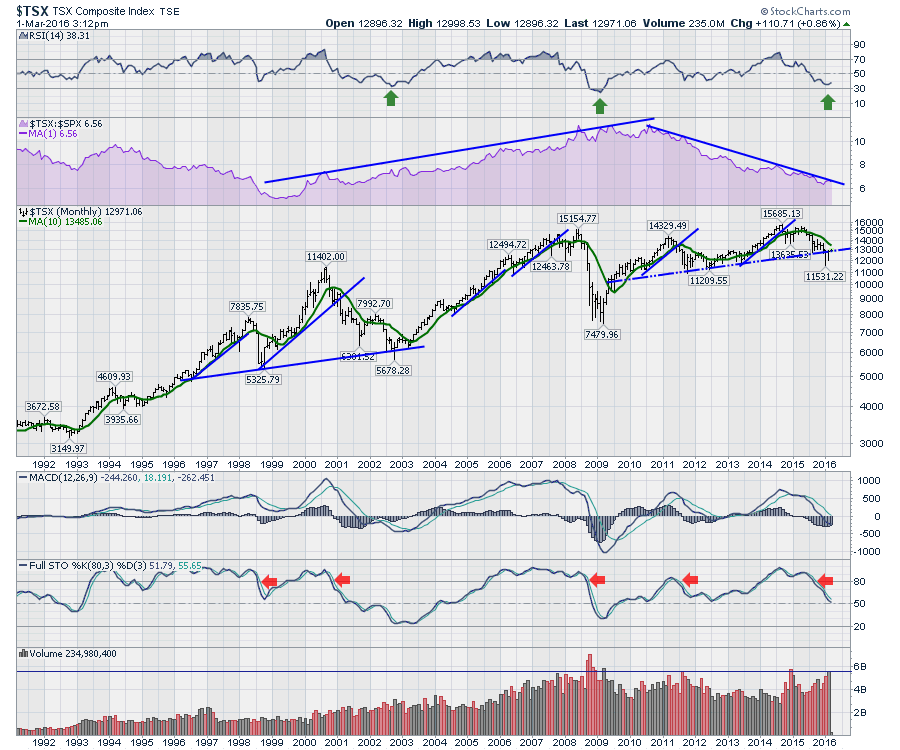
Whether it was Oil, Gold, or base metals that caught the eye of traders, it created some activity. The trading on the $TSX was big last month. I have put a volume chart at the bottom of the chart below, with a horizontal line at the volume for the end of February... Read More