ChartWatchers March 15, 2008 at 10:06 PM
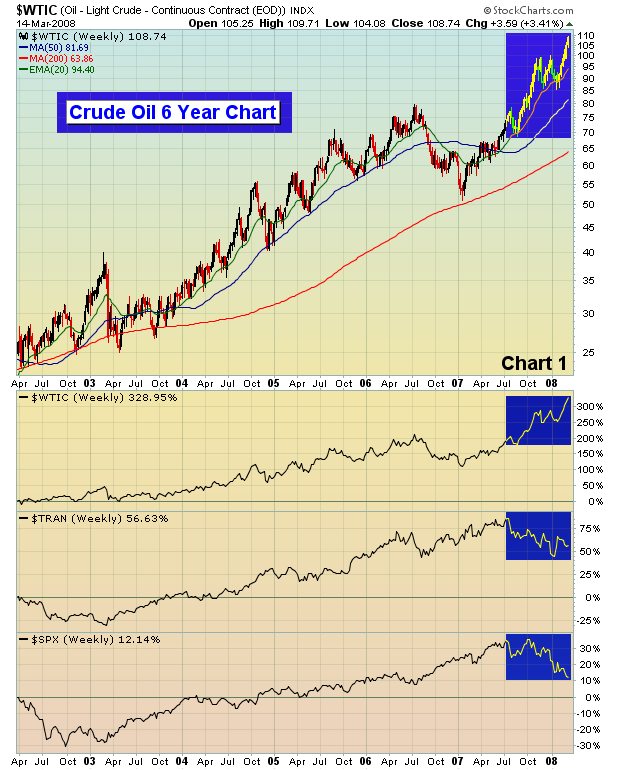
It makes perfect sense that higher oil prices could derail (no pun intended) transports as the implications are clear. But the truth might surprise you. From Chart 1 below, you'll see that oil prices have been rising dramatically over the past 6 years... Read More
ChartWatchers March 15, 2008 at 10:05 PM
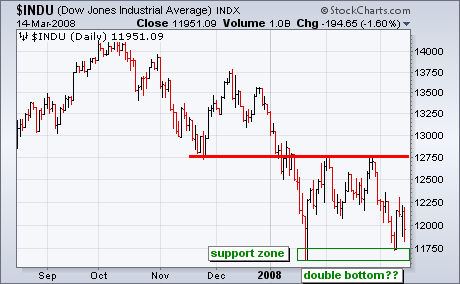
Technical analysis is a little art and a little science, which makes it subjective and open to interpretation. It is kind of like, gasp, economics. With a test of the January lows and a big surge on Tuesday, some pundits are talking double bottom... Read More
ChartWatchers March 15, 2008 at 10:04 PM
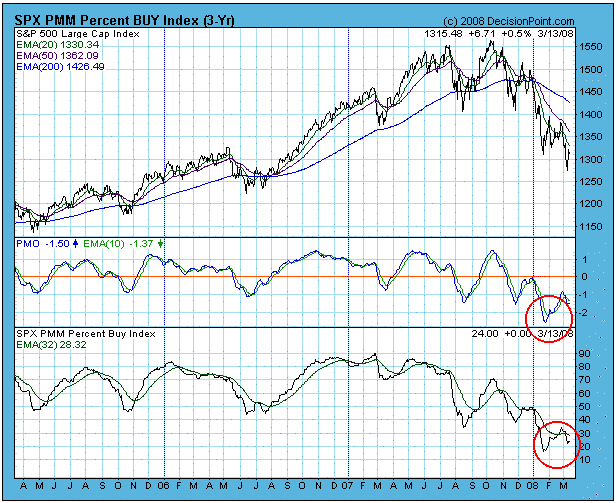
One of the reasons that Decision Point has spent so much time and money to create dozens of long-term historical chart series is that we must often compare current price and indicator behavior to prior periods where market action has been similar... Read More
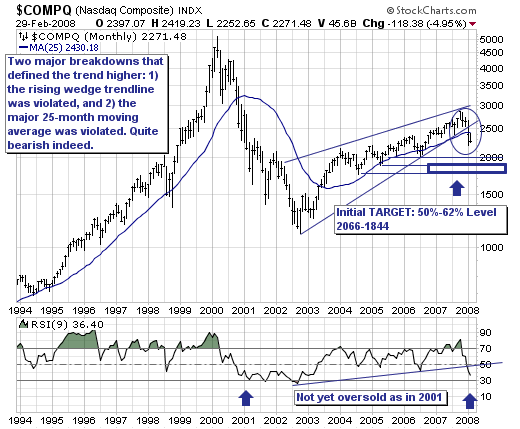
ChartWatchers March 15, 2008 at 10:03 PM
From a broader market perspective, the S&P 500 continues to weaken after having violated the 1982-2000 bull market was violated two weeks ago at near 1310. This would suggest that further weakness is forthcoming and quite sharp weakness at that... Read More
ChartWatchers March 15, 2008 at 10:02 PM
As we continue to evaluate alternative data feeds, we continue to be surprised by the results we are getting especially when it comes to data accuracy. Last week, we finally started charting intraday data from several different providers in our test lab... Read More
ChartWatchers March 15, 2008 at 10:01 PM
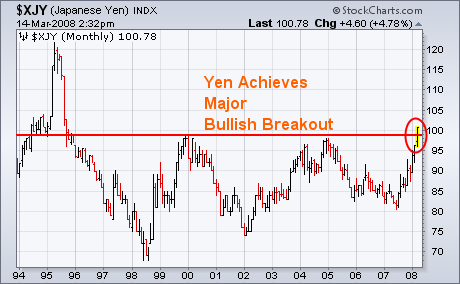
Last week I showed the Japanese Yen testing major chart resistance its 2000/2004 peaks. Today's 2% gain against the dollar put the yen over 100 for the first time in thirteen years (1995)... Read More
ChartWatchers March 15, 2008 at 10:00 PM
Hello Fellow ChartWatchers! A while back, demonstrated the concept of the Moving Average Ribbon here as a way for seeing the "waves and ripples" for any stock... Read More
ChartWatchers March 01, 2008 at 11:05 PM
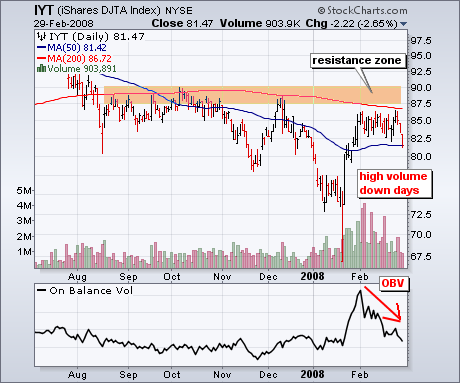
The Transport iShares (IYT) is an ETF designed to match the performance of the Dow Jones Transportation Average. The key industry groups include airlines, railroads, truckers and air freight, all of which are quite sensitive to the overall economy... Read More
ChartWatchers March 01, 2008 at 11:04 PM
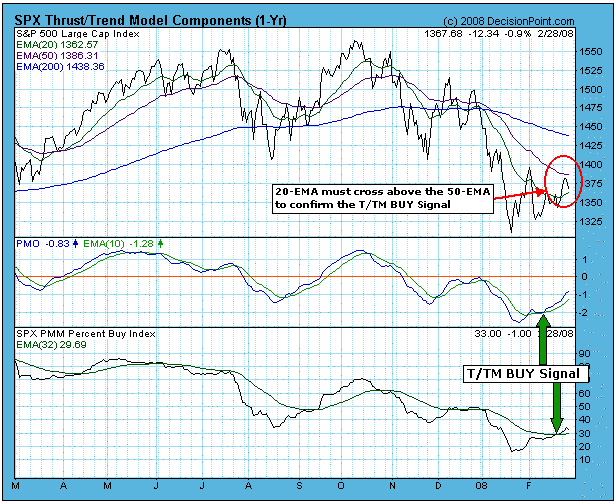
All mechanical models have weaknesses, and our Thrust/Trend Model is no exception – it is vulnerable to whipsaw... Read More
ChartWatchers March 01, 2008 at 11:03 PM
As the credit crisis continues to unfold in rather negative fashion; many believe that the US economy will not enter into a recession, and many believe that if we do enter into a recession - that it is likely to be short-lived and shallow... Read More
ChartWatchers March 01, 2008 at 11:01 PM
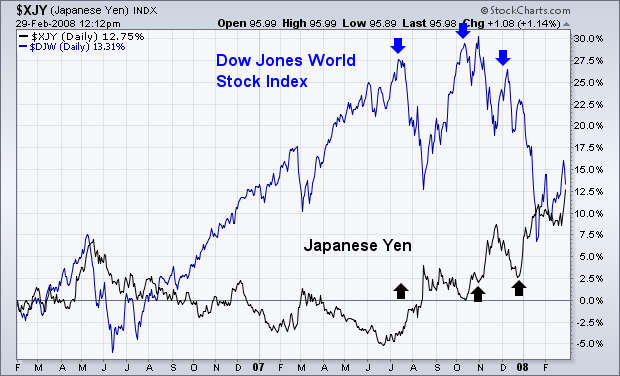
I first started writing about the danger posed to global stocks last summer when the yen first started rising. I also wrote that was because a rising yen was part of the unwinding of the so-called "yen carry trade"... Read More
ChartWatchers March 01, 2008 at 11:00 PM
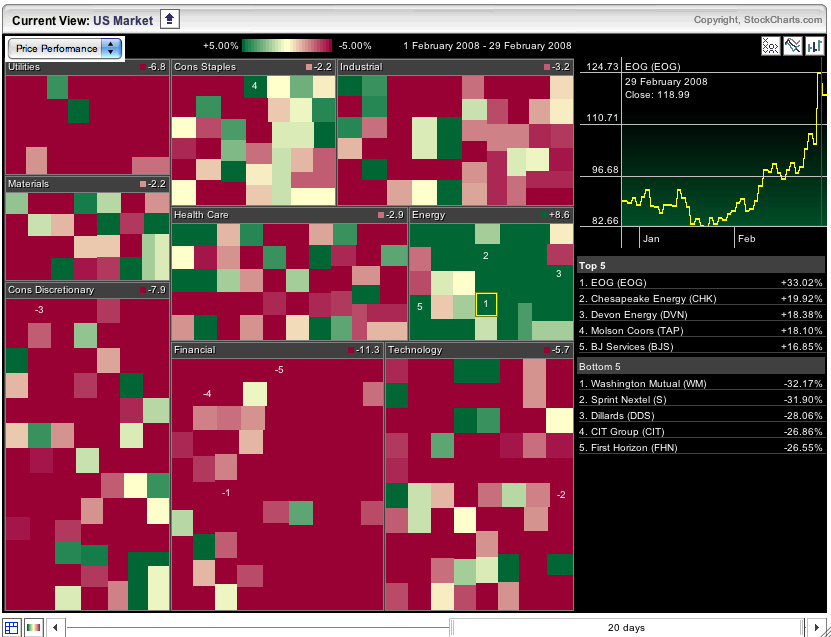
Hello Fellow ChartWatchers! Sorry for the ghastly title to this article, but the charts are rather ghastly as the moment and - as the image below shows - the damage is widespread: That is a snapshot of our S&P Sector Market Carpet right now... Read More