ChartWatchers April 19, 2008 at 10:05 PM
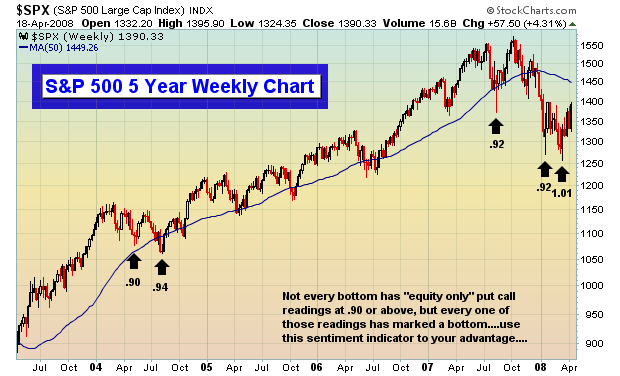
In the February 3rd edition of ChartWatchers, I made a bold prediction that the market had bottomed with the January lows. I did so because of the extreme pessimism in the options world... Read More
ChartWatchers April 19, 2008 at 10:04 PM
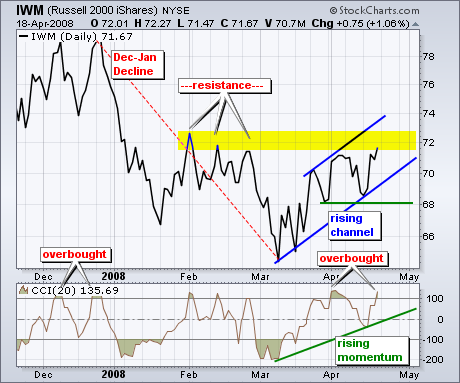
Despite a big advance over the last few weeks, the Russell 2000 ETF (IWM) entered a resistance zone and has become overbought. There are two reasons to expect resistance around 72. First, the three February highs mark resistance in this area... Read More
ChartWatchers April 19, 2008 at 10:03 PM
On Wednesday and Friday of this week the market opened up with large gaps from the previous closing price, and I think this activity is suspicious, possibly contrived. It is, after all, options expiration week, and weird market action can be expected... Read More
ChartWatchers April 19, 2008 at 10:02 PM
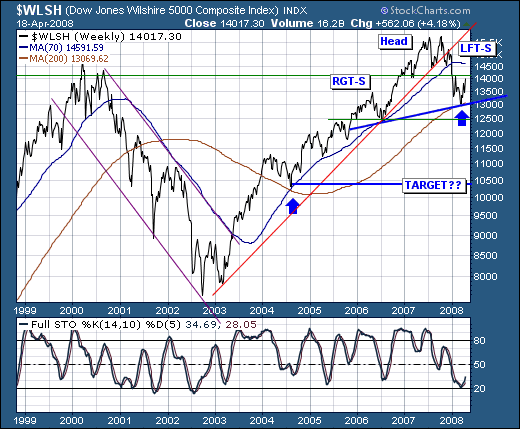
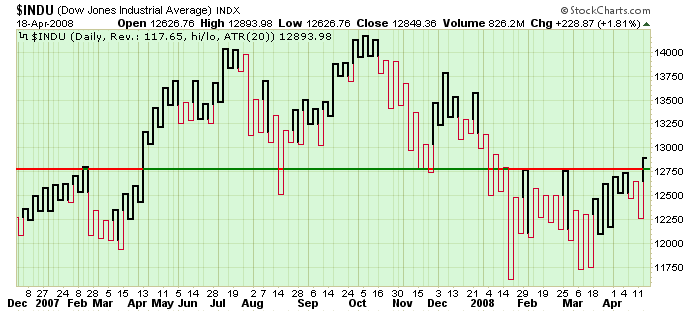
The intermediate-term broader market technical condition is improving; however, we believe that this "improvement" is nothing more than a respite before the larger storm develops... Read More
ChartWatchers April 19, 2008 at 10:01 PM
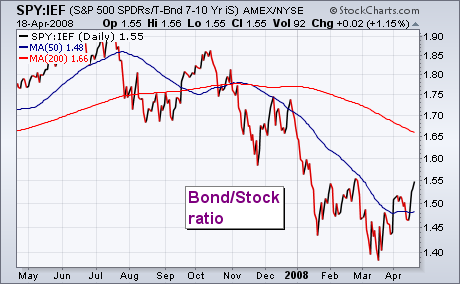
This week's market action has been characterized by stock buying and bond selling. The change in the relationship between those two markets is shown in the chart below which plots a ratio of the 7-10 Year Treasury Bond Fund (IEF) by the S&P 500 SPDRS (SPY)... Read More
ChartWatchers April 19, 2008 at 10:00 PM
StockCharts.com is pleased to announce that we have just added Kagi and Renko charting formats to our site. Go. Check em out. Hmmm... Why are you still here? Oh, right. Not everyone knows what Kagi and Renko charts are... Read More
ChartWatchers April 06, 2008 at 10:04 PM
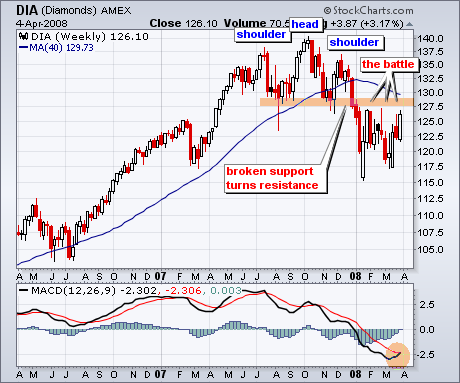
Despite some volatile price action the last few months, the Dow Industrials ETF (DIA) remains below a major support break and has yet to win the battle at resistance. DIA formed a rather large head-and-shoulders pattern in 2007 and broke support with a sharp decline in January... Read More
ChartWatchers April 06, 2008 at 10:03 PM
As a technician I rarely look at fundamentals, primarily because they are not directly useful in making trading decisions; however, while fundamentals are not primary timing tools, they can be useful in establishing a broader context within which technical indicators can be inter... Read More
ChartWatchers April 06, 2008 at 10:01 PM
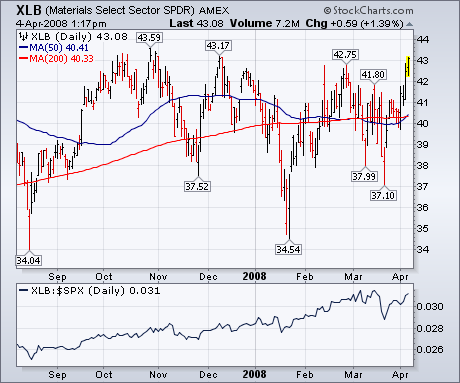
Throughout the market problems of the first quarter, stocks tied to basic materials have been the top performing sector. That's also been true over the last week. The chart below shows the Materials SPDR (XLB) trading over 43 today for the first time this year... Read More
ChartWatchers April 06, 2008 at 10:00 PM
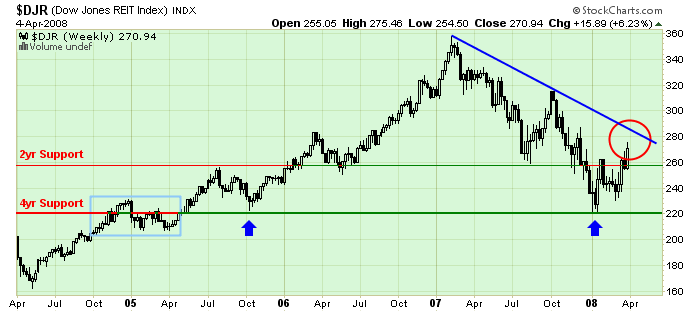
Hello Fellow ChartWatchers! The Real Estate industry is undergoing lots of challenges right now. Let's see how those challenges are affecting the REIT charts... Read More