ChartWatchers November 20, 2011 at 07:07 PM

Hello Fellow ChartWatchers! We have a jammed-packed edition of ChartWatchers for you this week. With the holiday season approaching fast (too fast if you ask me!) we're announcing several great Store specials that I urge you to look into to... Read More
ChartWatchers November 20, 2011 at 04:36 PM
SEND SOMEONE THE GIFT OF CHARTING WITH THE STOCKCHARTS HOLIDAY GIFT PACK! - We've bundled 6 months of our Extra service with one of John Murphy's best books, "The Visual Investor" and our exclusive 3-disc DVD set from this year's ChartCon conference... Read More
ChartWatchers November 19, 2011 at 05:07 PM
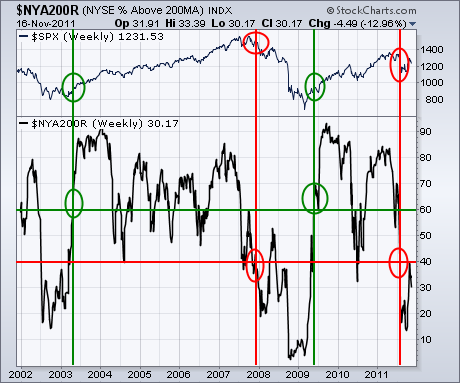
I'm going to focus on some longer term indicators today. And, right now, the ones I'm looking at still warrant a lot of caution. Chart 1, for example, shows the % NYSE stocks trading above their 200-day moving average ($NYA200R)... Read More
ChartWatchers November 19, 2011 at 05:04 PM
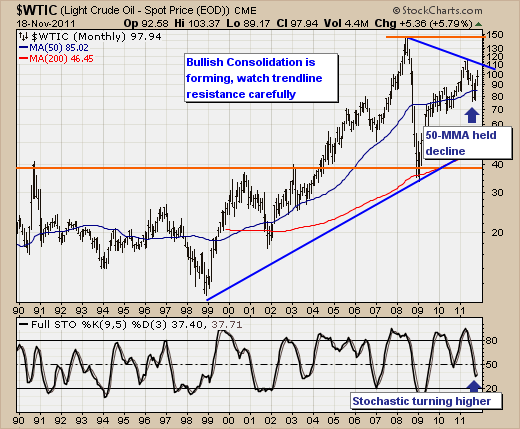
Over the past three months, we've seen the West Texas Intermediate Crude Oil futures ($WTIC) rise from low of $75/barrel to a high of $102/barrel, which is a rather large move in a very short period of time in what many consider to be a modest "risk-on" environment... Read More
ChartWatchers November 19, 2011 at 04:47 PM
On Thursday the S&P 500 broke down from a triangle formation, which is a kind of continuation pattern... Read More
ChartWatchers November 19, 2011 at 04:44 PM
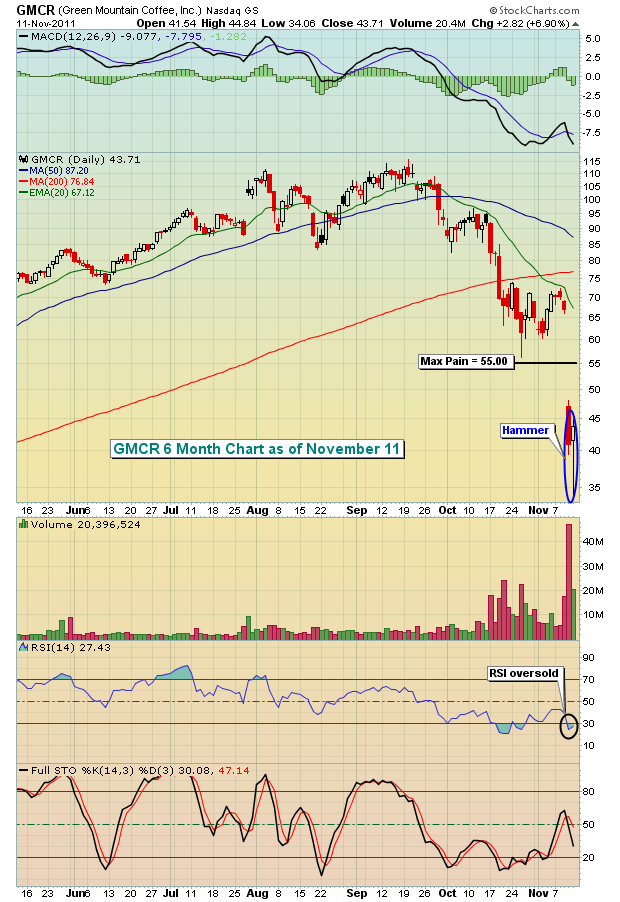
For an options expiration week, volume was quite light. Any time volume is light, the threat of market manipulation grows. As we headed into last week, max pain suggested a potential 2.5%-3.5% move lower in equity prices, depending on the index... Read More
ChartWatchers November 19, 2011 at 04:30 PM
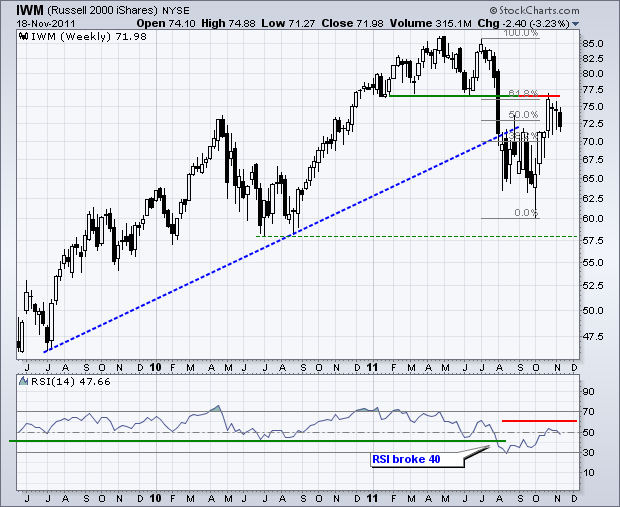
A number of bearish developments have emerged on the weekly chart for the Russell 2000 ETF (IWM). This weekly chart extends two and a half years to cover the long-term situation... Read More
ChartWatchers November 05, 2011 at 07:20 PM
GREG SCHNELL AND TOM BOWLEY IN CALGARY... First off, Tom Boley and Greg Schnell - two of our great market commentators - are teaming up to talk in Calgary this week... Read More
ChartWatchers November 05, 2011 at 06:48 PM
I am extremely happy to announce that StockCharts.com is now working with the good folks at Security Research Company (S.R.C.) to bring you high-quality historical financial charts based on their huge database of financial information... Read More
ChartWatchers November 05, 2011 at 04:00 PM
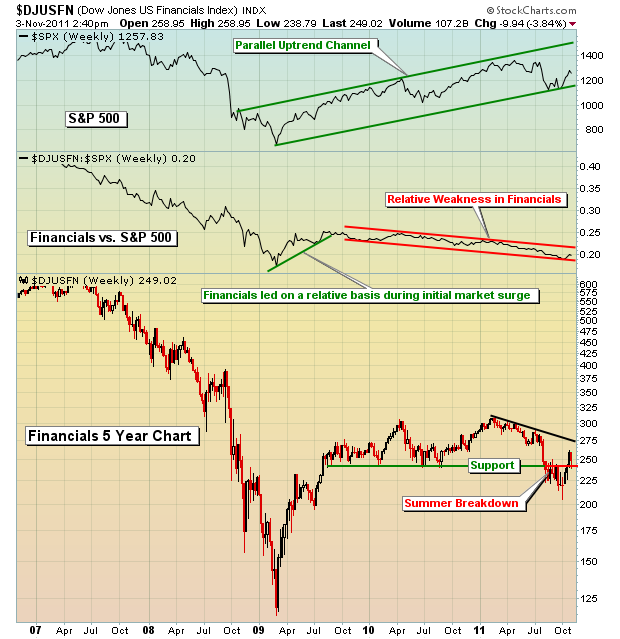
When you review the history of the stock market, you see that financials tend to hold the key for whether a stock market advance is sustainable or not... Read More
ChartWatchers November 05, 2011 at 04:00 PM
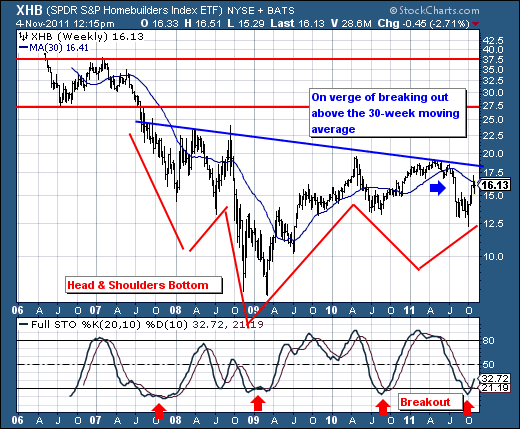
Quite simply, the past 5-week rally has been breathtaking, but it remains to be seen whether it has "legs" of whether it does not. It is of our opinion, that it "does have legs", and it does so given the Financials (XLF) are rallying..... Read More
ChartWatchers November 05, 2011 at 03:54 PM
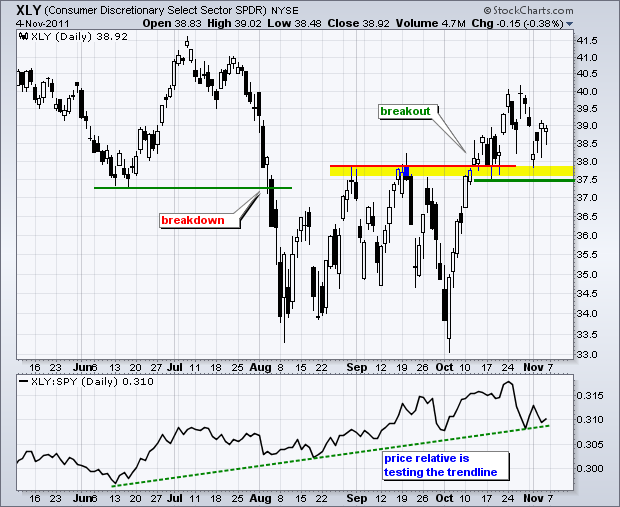
Earlier this week I noted that the Nasdaq 100 ETF, the Russell 2000 ETF and the S&P 500 ETF were testing broken resistance. The October surges produced breakouts and it is important that these resistance breakouts hold... Read More
ChartWatchers November 04, 2011 at 04:42 PM
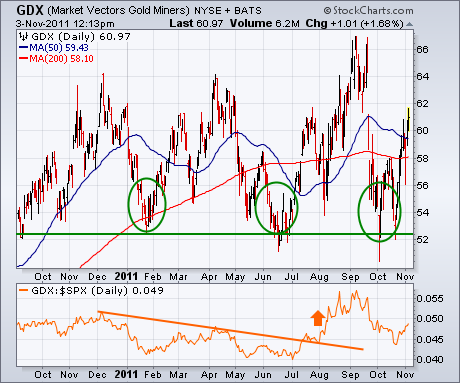
My Market Message from Tuesday of last week (October 25) wrote about new signs of strength emerging from an oversold gold-mining group. It showed the Market Vectors Gold Miners ETF (GDX) bouncing off chart support along its 2011 reaction lows (see circles in Figure 1)... Read More
ChartWatchers November 04, 2011 at 04:40 PM
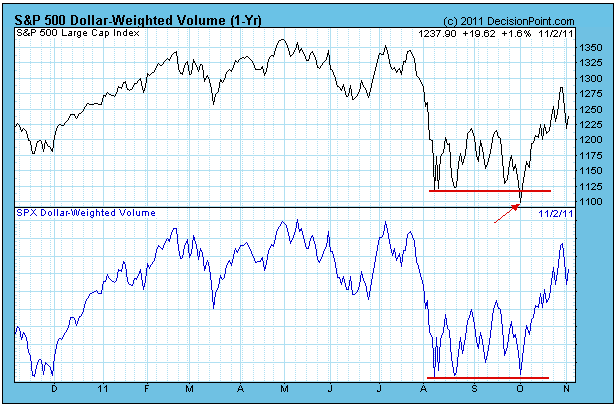
Over 10 years ago I developed an indicator called Dollar-Weighted Volume (DWV). It could be that I reinvented the wheel, but I am not aware of anyone else who uses this indicator. DWV is variation of On-Balance Volume (OBV), which was developed by Joe Granville... Read More