ChartWatchers May 19, 2013 at 12:34 PM
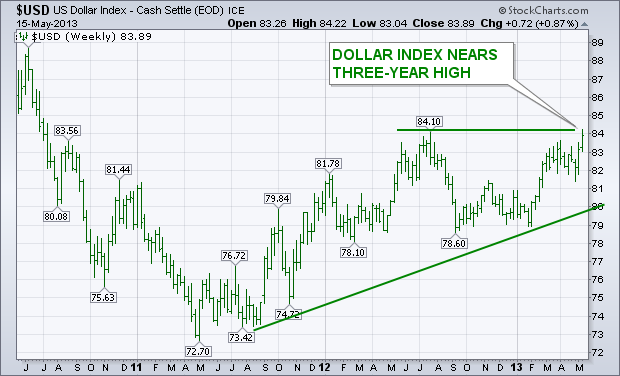
The chart below shows the U.S. Dollar Indexchallenging its mid-2012 high near 84. An upside breakout through that prior peak (which appears likely) would put the dollar at the highest level since mid-2010. The dollar has become the world's strongest currency... Read More
ChartWatchers May 18, 2013 at 03:01 PM
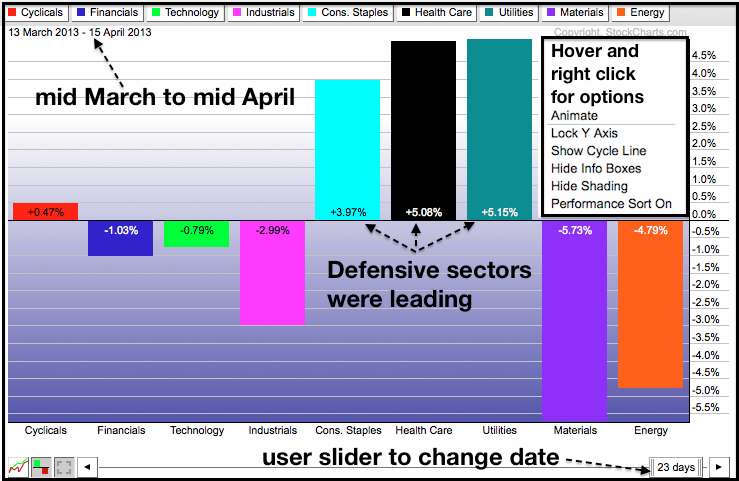
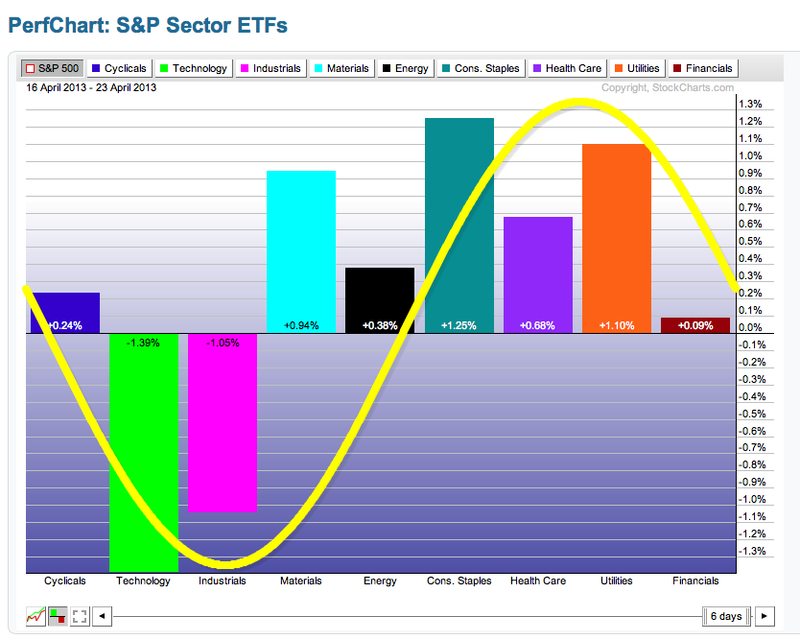
There were concerns a month ago when the defensive sectors were leading the market, but this changed as the offensive sectors took control over the past month. The defensive sectors include healthcare, consumer staples and utilities... Read More
ChartWatchers May 18, 2013 at 02:28 PM
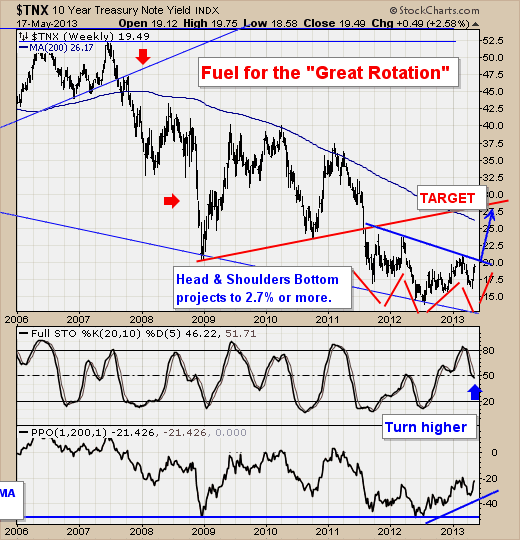
The Great Rotation is in its early stages. For those initiated to this concept, it is simply that rising interest rates will cause asset allocators to sell bonds and buy stocks... Read More
ChartWatchers May 18, 2013 at 02:25 PM
So much for "Go away in May"! I've written in the past that this is VERY misleading information that's routinely provided to the investing public. For example, the month of May is one of the best months of the year to invest in small caps... Read More
ChartWatchers May 17, 2013 at 09:46 PM
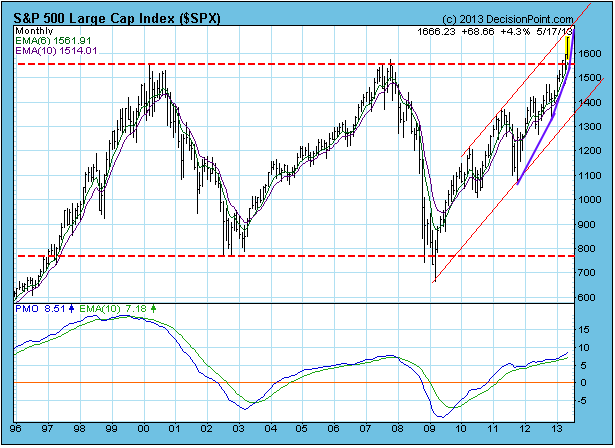
While we tend to focus more on the short and intermediate term, we notice that there is a lot going on in the long term time frame. Most obvious is the breakout above the top of a long-term trading range... Read More
ChartWatchers May 17, 2013 at 07:43 PM
Hello Fellow ChartWatchers! Today we started our Spring Special for 2013. As long-time ChartWatchers know, it is important to take advantage of our specials when we hold them in order to minimize your charting costs... Read More
ChartWatchers May 05, 2013 at 12:29 AM
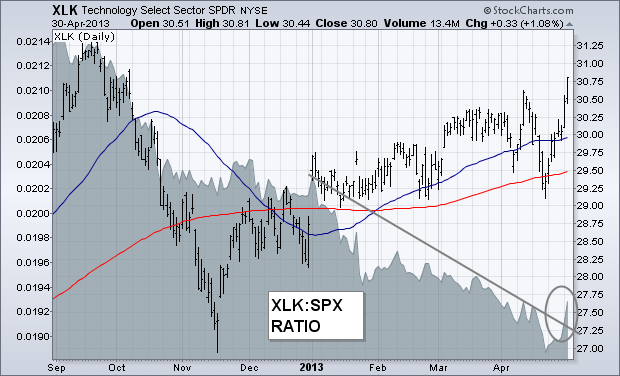
Thursday, April 25th I wrote about the technololgy sector being one of the markets weakest groups this year. That may finally be changing for the better... Read More
ChartWatchers May 05, 2013 at 12:23 AM
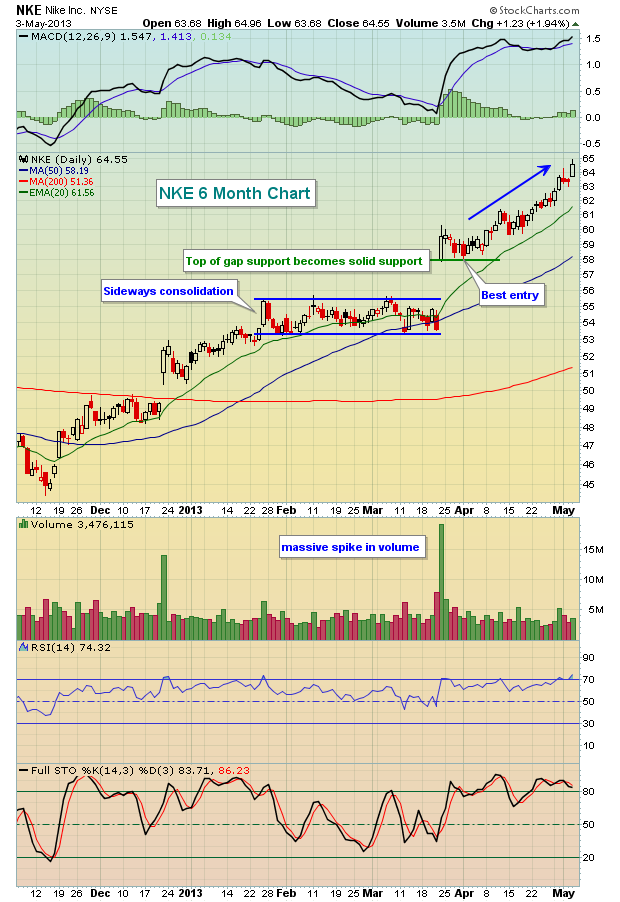
Every quarter, my goal is to identify the absolute best stocks that I can find from both a technical and fundamental standpoint... Read More
ChartWatchers May 05, 2013 at 12:21 AM
On a huge macro scale, we are trying to break out of a consolidation range. 13 year. Breaking out on Dow, SP500, Nasdaq, $RUT. Unfortunately, the rest of the globe has not been confirming... Read More
ChartWatchers May 05, 2013 at 12:16 AM

The current S&P 500 rally to new all-time highs may very well be the beginning of a "bubble-like" move to much higher levels in the weeks and months ahead... Read More
ChartWatchers May 03, 2013 at 08:41 PM
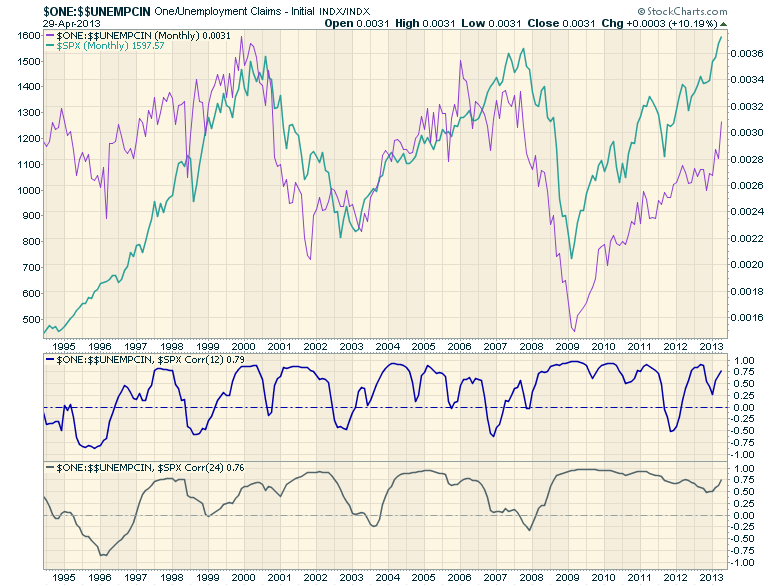
Hello Fellow ChartWatchers! As I mentioned last time, we've recently started adding key economic datasets to our database so that you can chart them with our SharpCharts charting tool... Read More
ChartWatchers May 03, 2013 at 07:36 PM
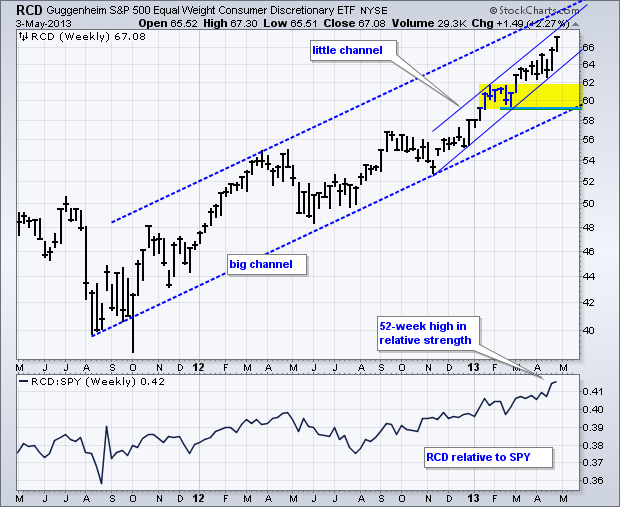
The Equal-weight Consumer Discretionary ETF (RCD) and the Retail SPDR (XRT) hit 52-week highs in price and relative strength this week. New highs and relative strength in these two groups is very positive for the market overall... Read More
ChartWatchers May 03, 2013 at 05:04 PM
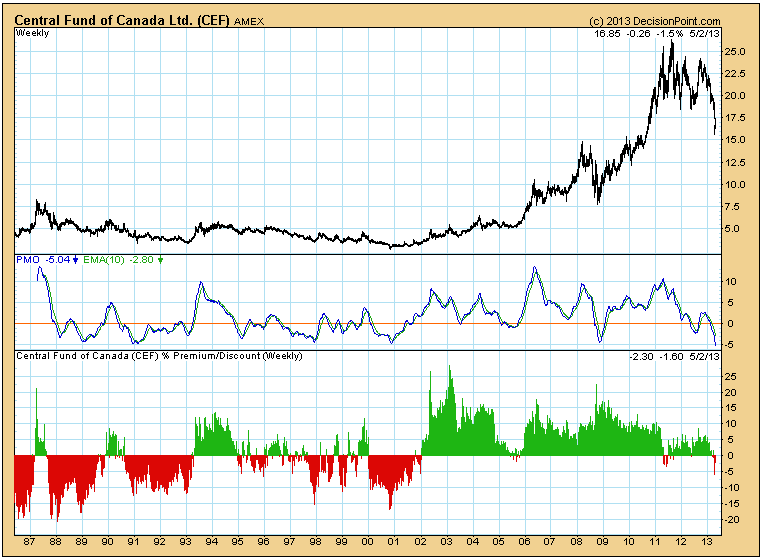
With the recent volatility in gold and silver prices, it would be nice to get an idea of what kind of sentiment is being generated. Measures of sentiment tell us if there is too much optimism or pessimism in a particular market... Read More