ChartWatchers February 15, 2014 at 08:50 PM
The StockCharts charting tools are very powerful but can be a little confusing at first, especially if you are used to the simpler charting tool on DecisionPoint.com. So I wanted to take time today and talk a little bit about the differences between those two tools... Read More
ChartWatchers February 15, 2014 at 08:14 PM
Hello Fellow ChartWatchers! Just in time for the ongoing February rally, I'm thrilled to announce the launch of the DecisionPoint Market Analysis Chart Gallery! As you probably know, we have recently acquired DecisionPoint... Read More
ChartWatchers February 15, 2014 at 08:13 PM
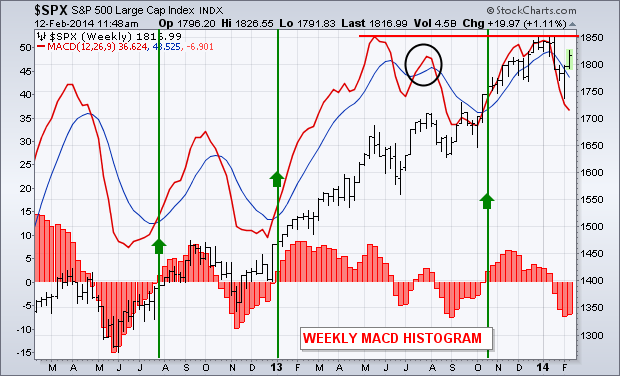
The daily MACD for QQQ, SPY and DIA have turned positive. Weekly MACD lines, however, are still negative. That's not unusual since weekly lines are slower to turn. Weekly lines, however, measure the stock market's longer trend... Read More
ChartWatchers February 15, 2014 at 07:56 PM
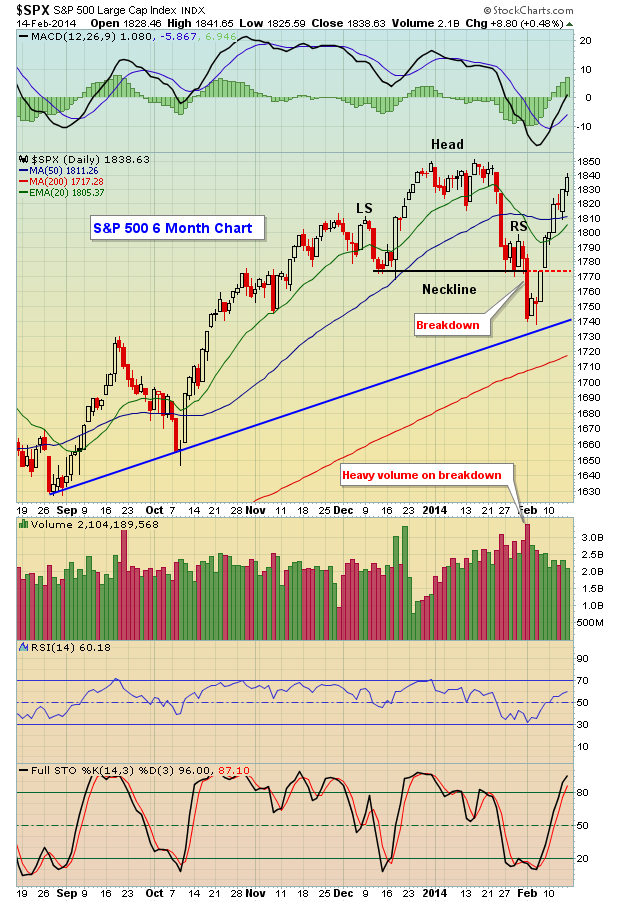
Just two weeks ago, the stock market seemed on the verge of its first correction in a long time - all within the confines of a long-term bull market that began in March 2009. Then came the breakdown I was looking for to confirm it... Read More
ChartWatchers February 15, 2014 at 01:51 PM
The Chartwatchers newsletter is an interesting one. On all the other blogs, we write whenever we see something interesting on a daily basis, but the ChartWatchers newsletter is unique... Read More
ChartWatchers February 15, 2014 at 11:21 AM
Chartists can find sectors with consistent performance by analyzing PerfCharts across different timeframes. The three PerfCharts show different performance periods for the S&P 500 and the nine sector SPDRs... Read More
ChartWatchers February 09, 2014 at 04:25 PM
Hello Fellow ChartWatchers! I've got just a short, mini-version of our newsletter for you this week with some important information on a couple of topics: John Murphy's latest market outlook A new, free(!) online book from John Murphy ChartCon 2014 - our upcoming conference in Se... Read More
ChartWatchers February 02, 2014 at 01:53 PM

Hello Fellow ChartWatchers! And that includes a special "Hello!" to all DecisionPoint.com members that have just joined us. Yes, in case you haven't heard, StockCharts.com has acquired DecisionPoint... Read More
ChartWatchers February 01, 2014 at 08:50 PM
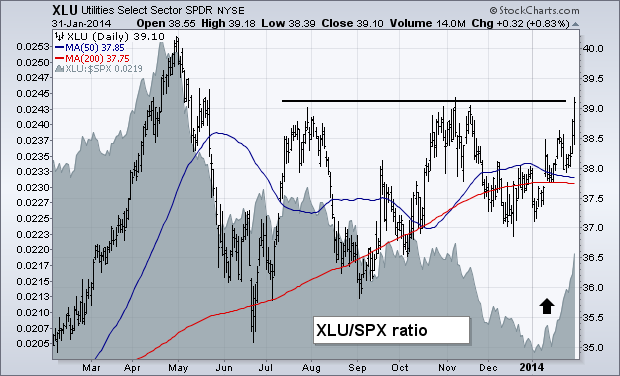
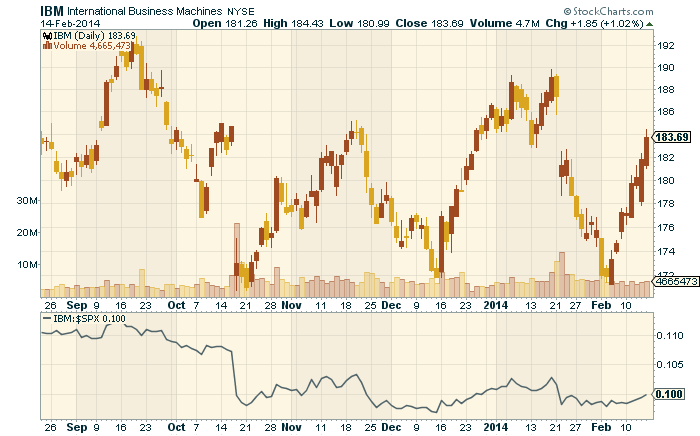
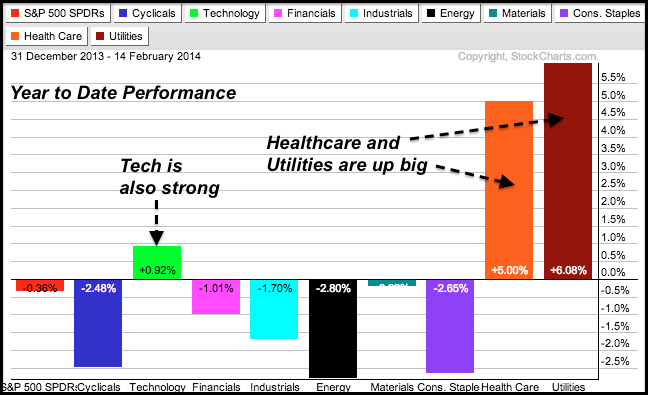
An early January message (January 11) talked about the need to do some rotating out of over-extended stock market groups that did especially well during 2013 into more defensive (and dividend-paying) groups that had been market laggards... Read More
ChartWatchers February 01, 2014 at 08:42 PM
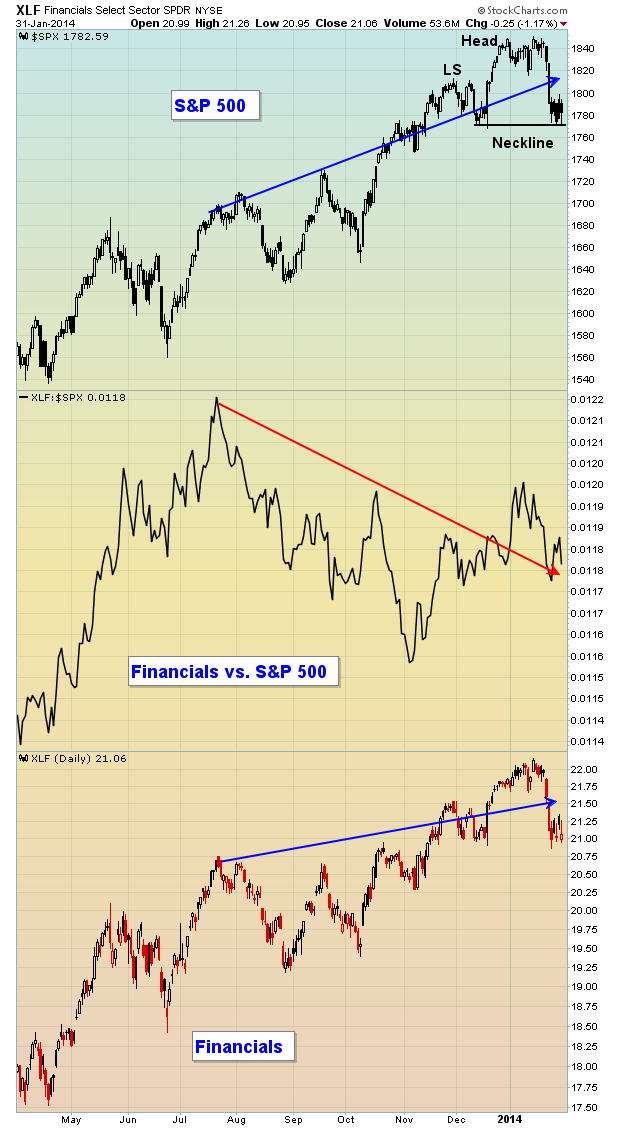
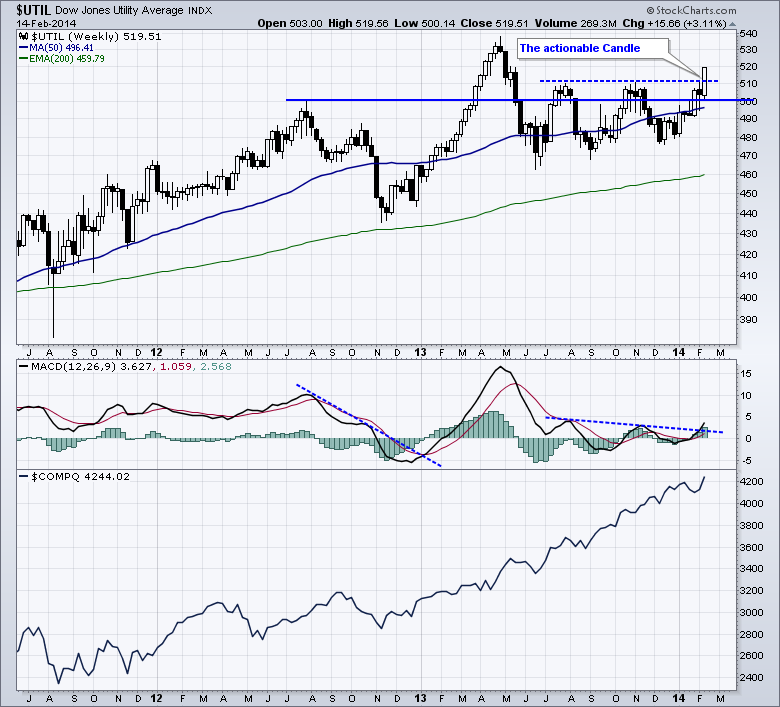
Signs of a sustainable bull market rally include strong relative performance from financial stocks, especially banks, and rising treasury yields that result from rotation away from treasuries... Read More
ChartWatchers February 01, 2014 at 06:10 AM
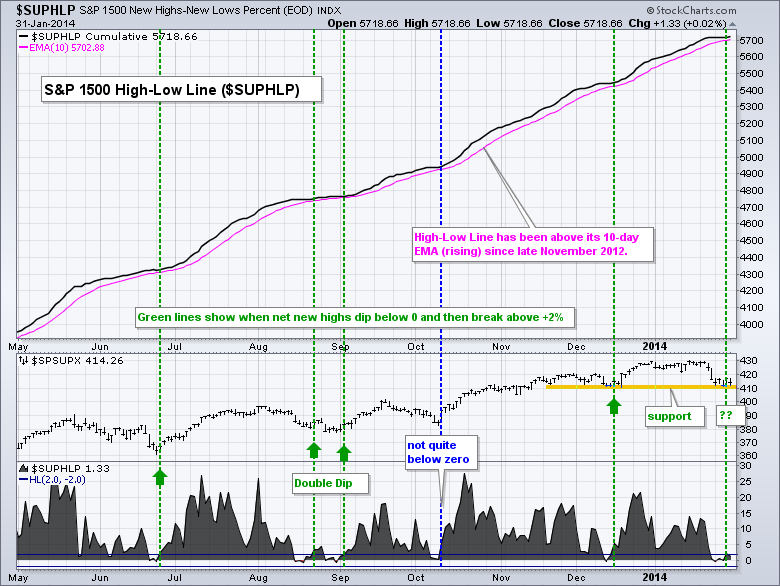
High-Low Percent for the S&P 1500 dipped into negative territory in late January. This is potentially significant because prior dips did not extend past the -2% level and marked turning points in the S&P 1500... Read More