ChartWatchers May 17, 2015 at 12:41 PM
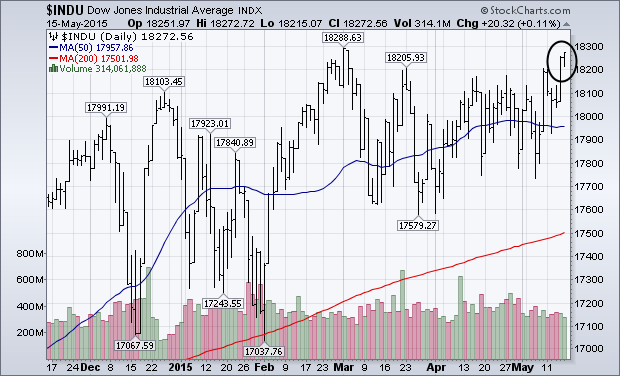
I've been writing about the continuing discrepancy between three Dow Averages. But things may be starting to improve. Chart 1 shows the Dow Industrials closing at a three-month high and just shy of its early March peak. [The S&P 500 ended at a record close]. All of this is good... Read More
ChartWatchers May 17, 2015 at 11:50 AM
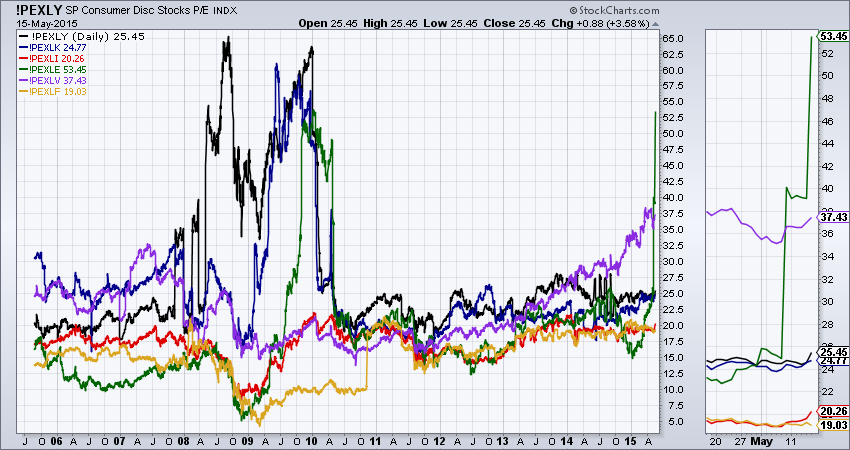
Hello Fellow ChartWatchers! Last time I reviewed our PE Ratio symbols for several major indexes (!PEDOW,!PESPX, !PEOEX, and !PENDX) and promised that this time around I'd show you the PE Ratio symbols we have for the nine S&P Sectors... Read More
ChartWatchers May 17, 2015 at 08:32 AM
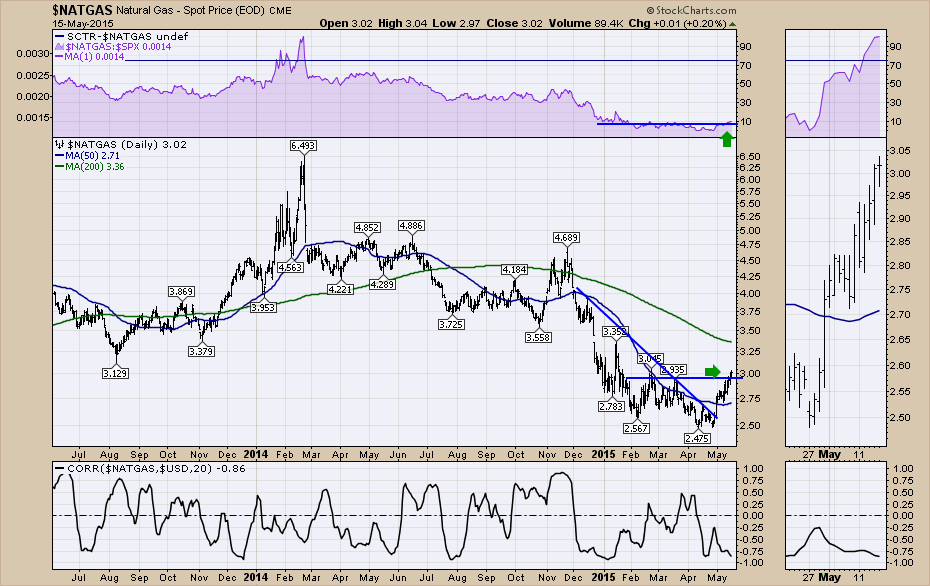
Natural Gas ($NATGAS) has had a flickering pilot light since February 2014. During November, 2014, Natural Gas finally got back above the 200 DMA only to lure in buyers and then starting falling... Read More
ChartWatchers May 16, 2015 at 02:26 PM
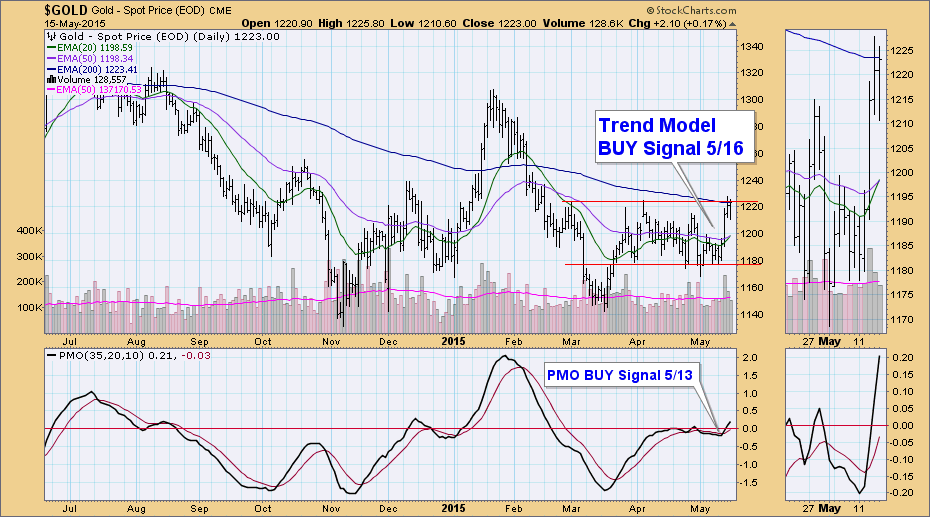
As of 5/16/2015 Gold is on a Trend Model BUY signal. The 20-EMA crossed above the 50-EMA triggering the new intermediate-term Trend Model to initiate a BUY signal... Read More
ChartWatchers May 16, 2015 at 10:11 AM
Over the past month, the Consumer Electronics Index ($DJUSCE) has fallen close to 9%, which ranks it as the third worst performing industry group. Only gambling stocks (-12.64%) and business training & employment agencies (-15... Read More
ChartWatchers May 16, 2015 at 03:21 AM
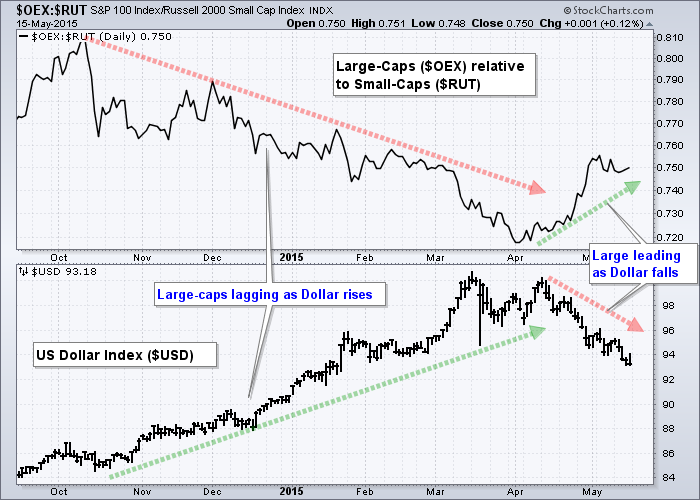
The falling Dollar is boosting large-caps and they are outperforming small-caps. This makes sense because large-caps are typically multinational companies that derive a good portion of their revenue abroad... Read More
ChartWatchers May 03, 2015 at 12:39 PM
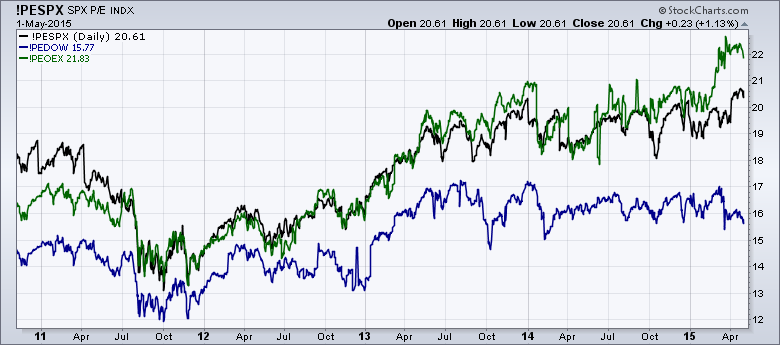
Hello Fellow ChartWatchers! Is the market too expensive right now? Our P/E ratios for the various market indexes can show you the answer to that question... Read More
ChartWatchers May 02, 2015 at 07:05 PM
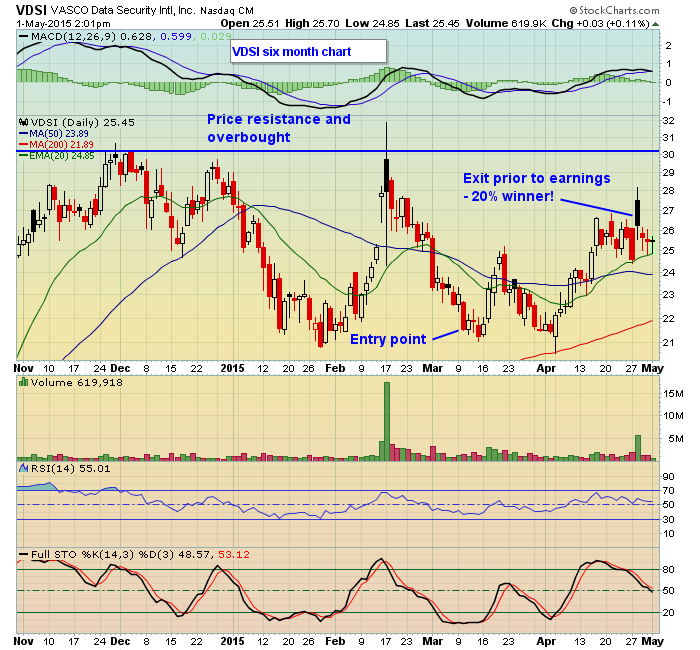
And the answer is...You bet! Why do earnings reports matter? Because it gives investors a quarterly snapshot of how a company is performing and what they can look forward to down the road... Read More
ChartWatchers May 02, 2015 at 03:22 PM
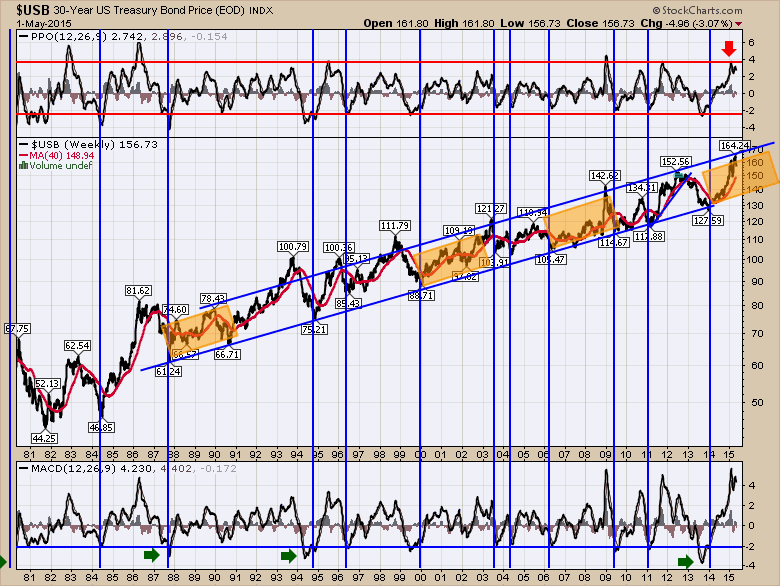
The long bond price looks to be at a level of major reversal. Diving into the chart, we can see that the PPO is at another one of the extreme levels in the entire 30 year bond run... Read More
ChartWatchers May 02, 2015 at 02:28 PM
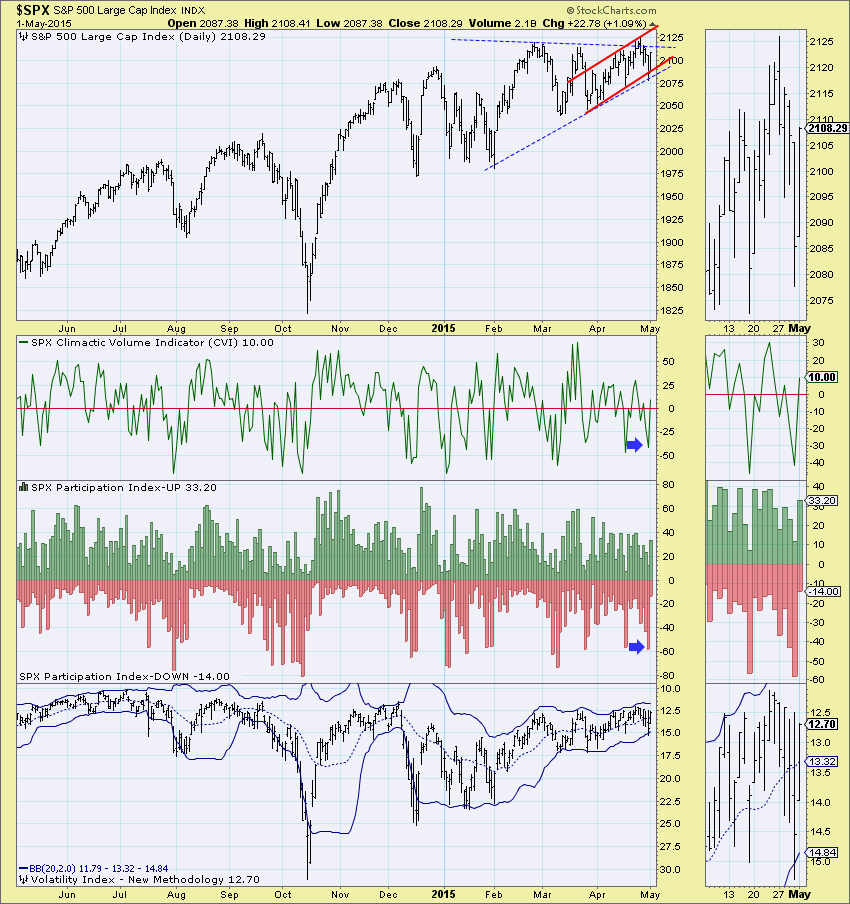
Last week was not only an interesting for price, ultra-short-term indicators finally woke up. With indicators staying mostly mum this week, it was exciting to see movement in the shorter-term... Read More
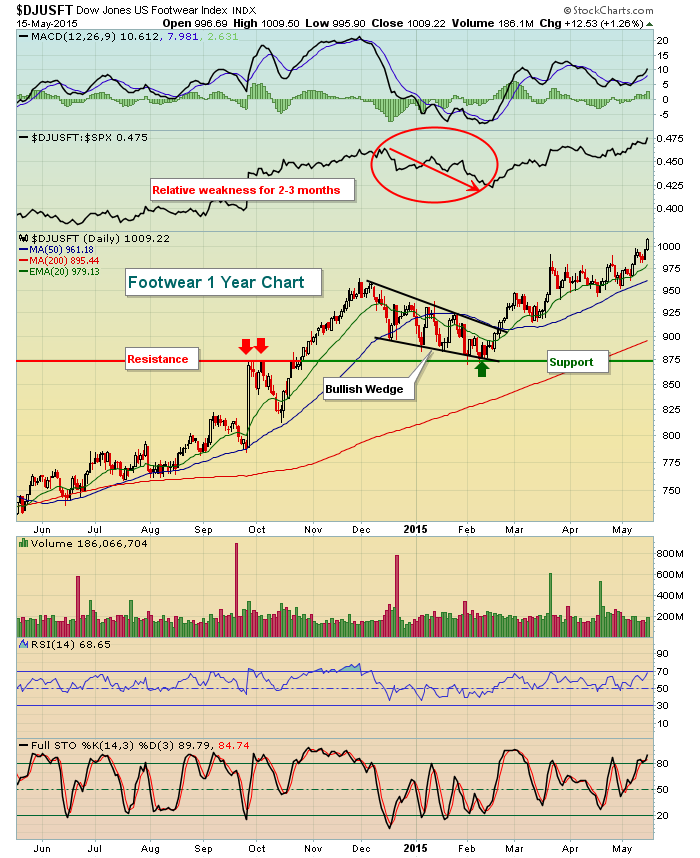
ChartWatchers May 02, 2015 at 01:59 PM
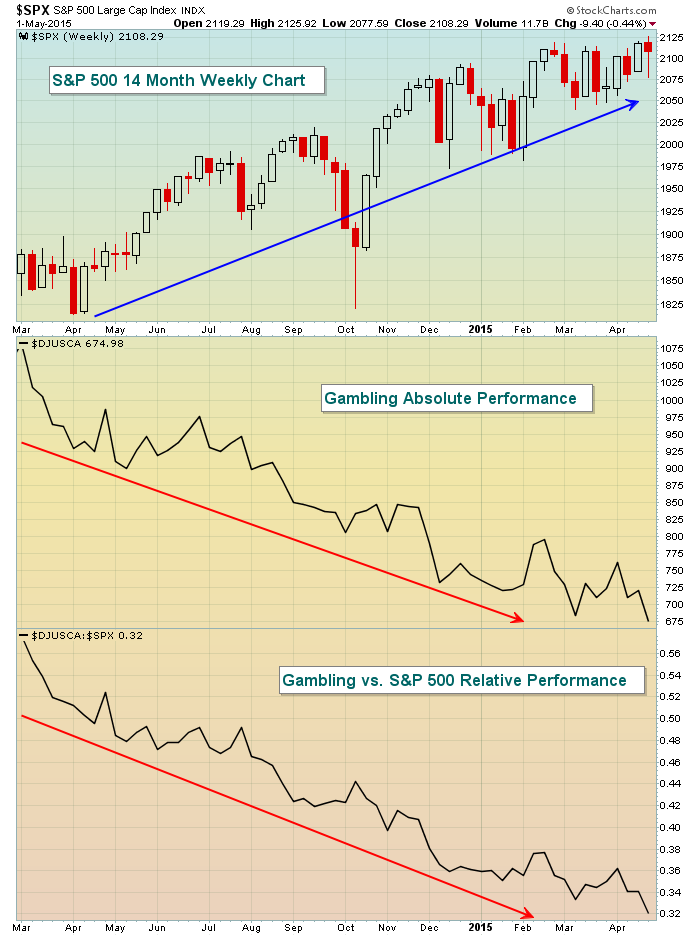
It's Kentucky Derby Day so of course! Oops, wrong blog! :-) We know that the stock market goes through periods of consolidation and rotation. Groups that lead for a period of time eventually fall out of favor as new groups emerge as leaders. Then we rinse and repeat... Read More
ChartWatchers May 02, 2015 at 05:00 AM
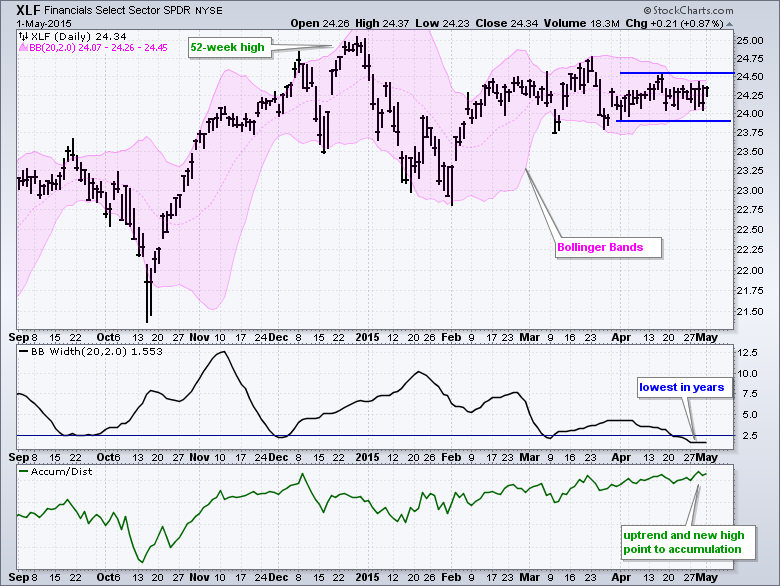
The Finance SPDR (XLF) has become the most boring of the nine sector SPDRs over the last five weeks. Boring today does not mean it will be boring tomorrow though... Read More