ChartWatchers June 21, 2015 at 01:55 AM
What a week! First, on Wednesday the Fed made its interest rate announcement, making it clear they are going to leave all options open, including the pace at which rates are changed in the future... Read More
ChartWatchers June 20, 2015 at 06:00 PM
Hello Fellow ChartWatchers! You know, sometimes we overthink things... Read More
ChartWatchers June 20, 2015 at 09:58 AM
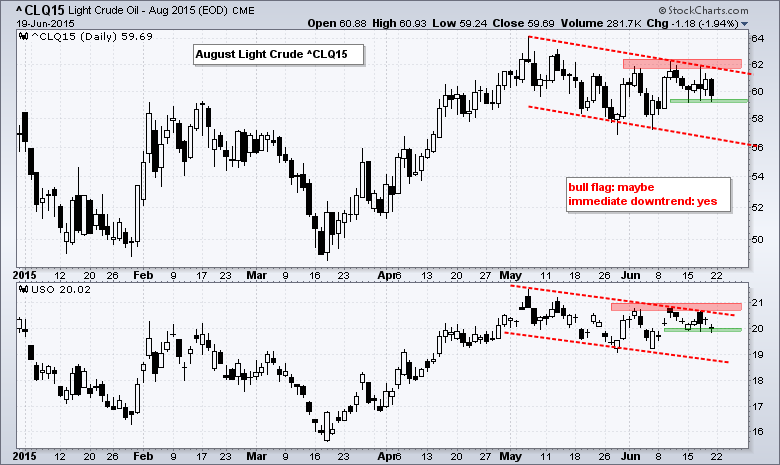
Oil surged in early June and looked poised to break flag resistance. A little follow through last week was all that was needed. US stocks did their part as the Russell 2000 and Nasdaq hit new highs. The Dollar did its part as the US Dollar Index fell 2.8% this month... Read More
ChartWatchers June 20, 2015 at 08:42 AM
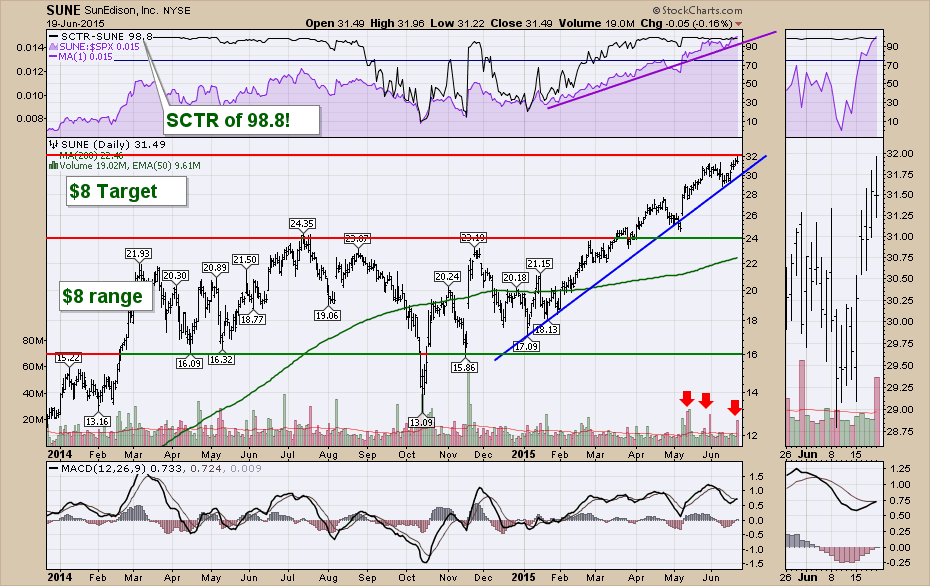
Back in December we reviewed a group of Solar related stocks and positioned our ChartLists for alerts if they did break out. Well, that worked out swimmingly well as January brought the all clear and the stocks soared. Lots of them shot up and made nice big moves to the upside... Read More
ChartWatchers June 06, 2015 at 10:23 PM
Hello Fellow ChartWatchers! The markets continue to lose momentum and carve out toppish type patterns on the main index charts. We, on the other hand, continue to crank out webinars with great commentary and content for chartists like yourself... Read More
ChartWatchers June 06, 2015 at 03:05 PM
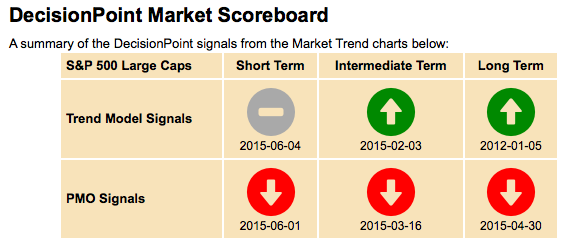
If you haven't checked out the new DP Scoreboard in the DP Chart Gallery, I highly recommend you click over there soon. In fact, here is an article I wrote about the Scoreboard and how the signals are determined right here... Read More
ChartWatchers June 06, 2015 at 02:43 PM
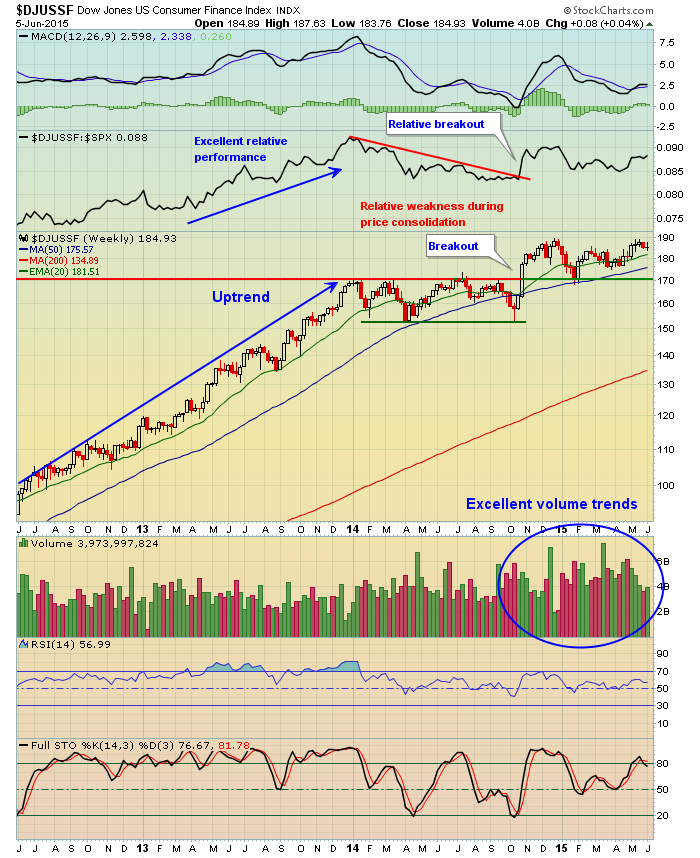
A solid labor market had bond traders heading for the exits on Friday and that extended the recent surge in treasury yields. The 10 year treasury yield ($TNX) closed at its highest level since early October and that has many traders heading for the financial sector... Read More
ChartWatchers June 06, 2015 at 01:47 PM
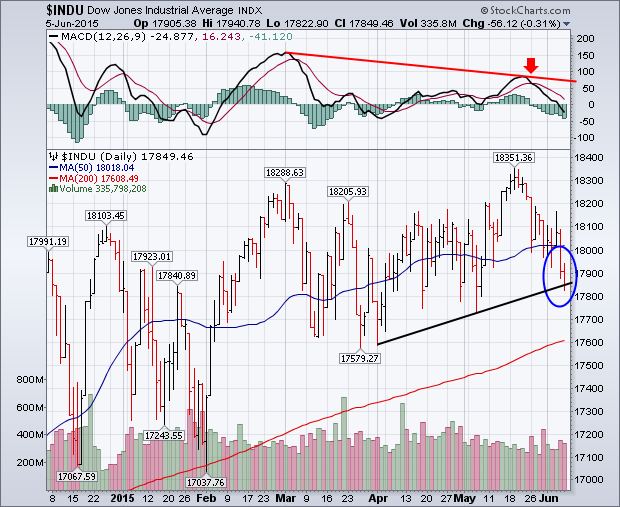
U.S. stocks lost ground during the week, but not enough to do any serious chart damage. Chart 1 shows the Dow Industrials falling to the lowest level in a month and sliding below its 50-day moving average (in rising volume)... Read More
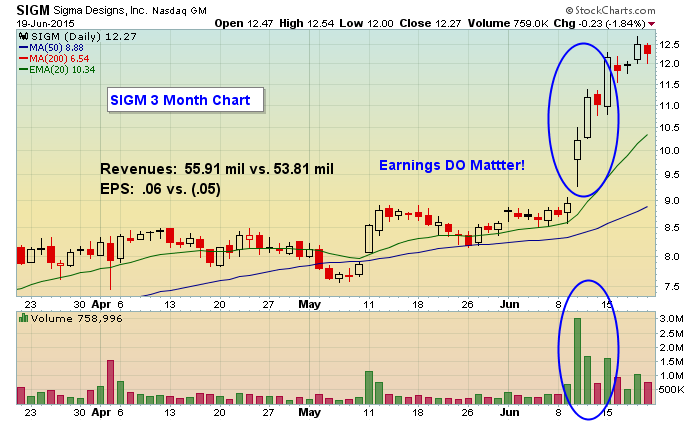
ChartWatchers June 06, 2015 at 01:37 PM
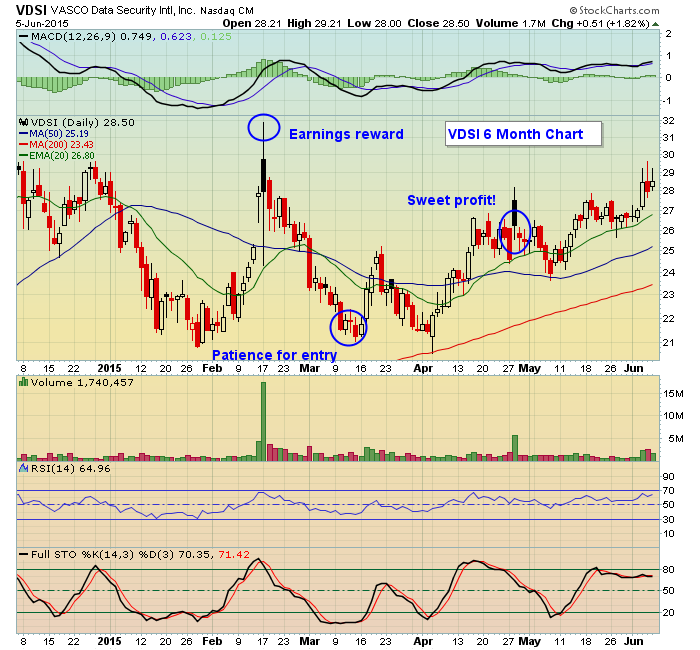
It seems like an easy enough concept to grasp. If a company has strong fundamentals (earnings) plus a strong chart (technicals) it should make a stock a strong reward to risk trading candidate. It turns out it does... Read More
ChartWatchers June 06, 2015 at 11:33 AM
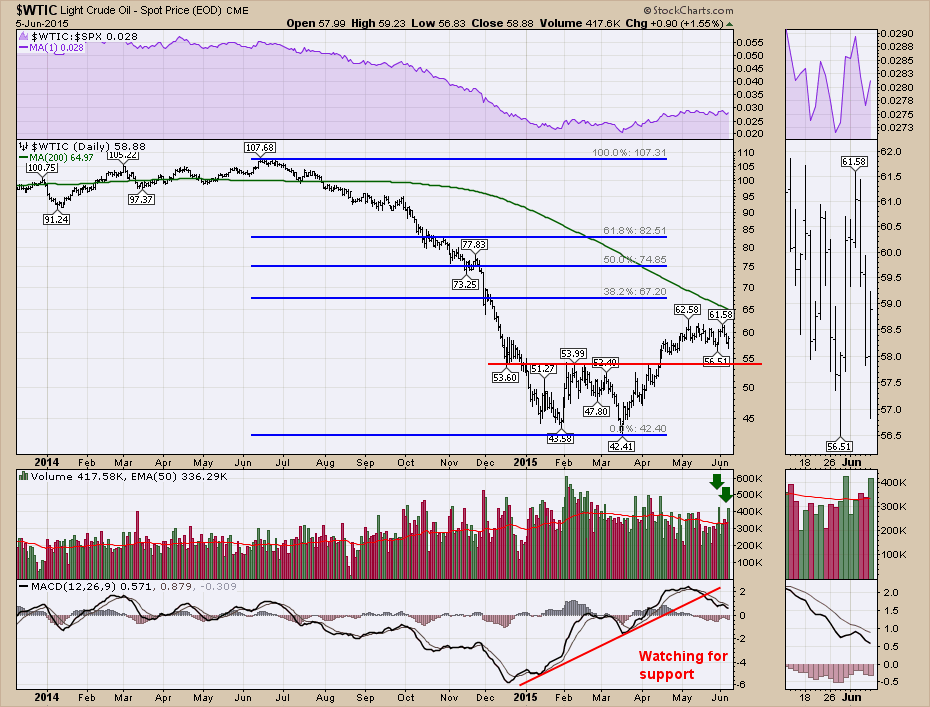
Crude Oil is the engine of nations. On June 13th, 2014 crude oil peaked and started a precipitous decline. From an intraday high of $107.68 to a low of $42.41 it has been a painful ride for energy companies and the oil and gas service sector... Read More
ChartWatchers June 06, 2015 at 06:11 AM
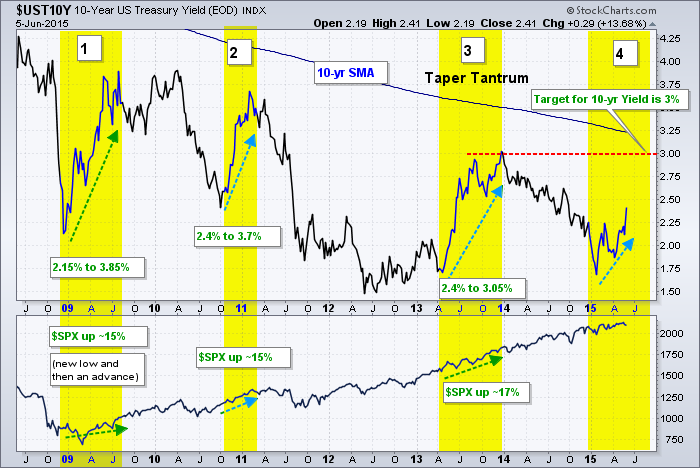
There have been four big surges in the 10-year Treasury Yield since the bull market for the S&P 500 began in 2009... Read More