ChartWatchers July 29, 2016 at 08:36 PM
The DecisionPoint Scoreboards stopped changing on July 8th as the final BUY signal was added to the Nasdaq 100's Scoreboard... Read More
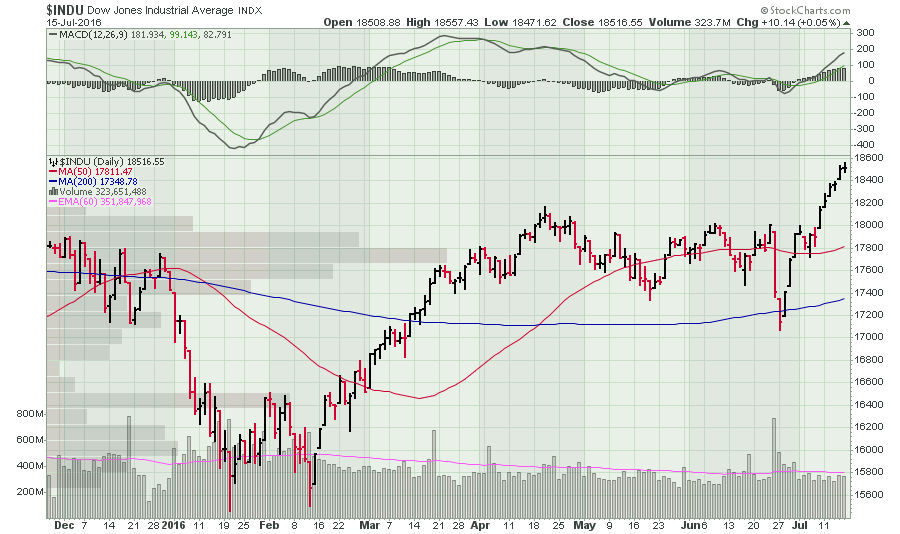
ChartWatchers July 17, 2016 at 06:07 PM
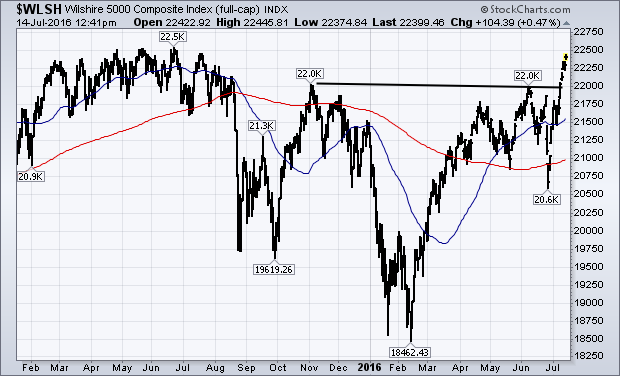
The Dow Industrials and S&P 500 continue to hit record highs. I've been showing upside breakouts in other parts of the market that include small caps and the NYSE Composite Index. Here's another one... Read More
ChartWatchers July 17, 2016 at 05:58 PM
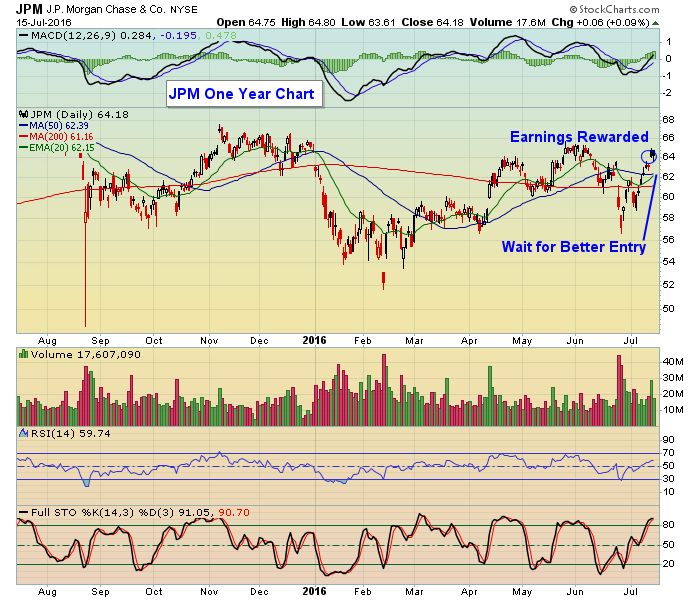
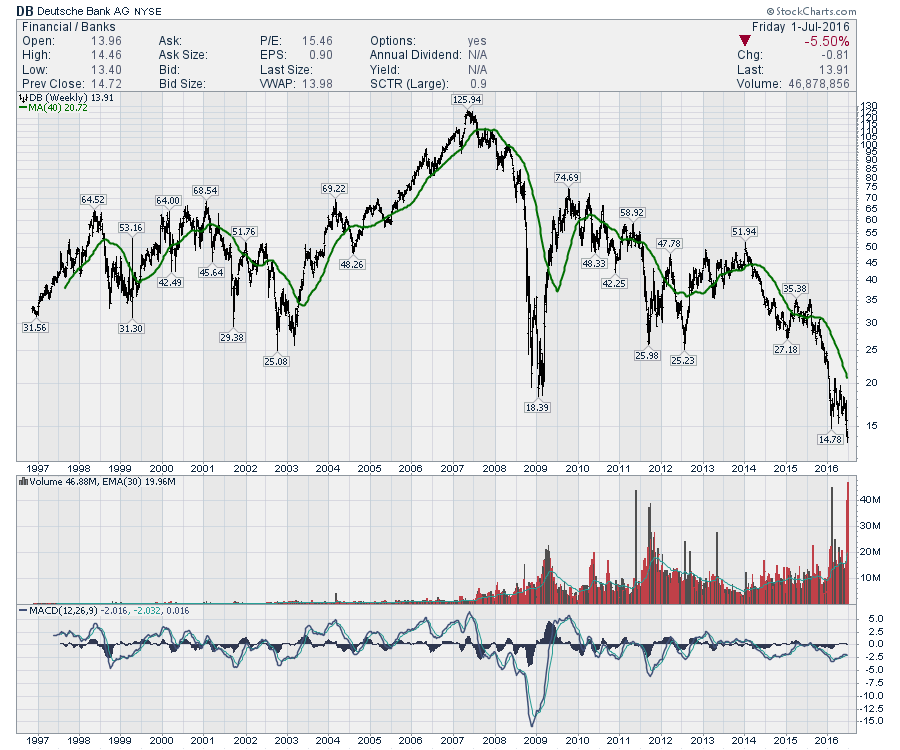
The "official" start to earnings season began when Alcoa reported its numbers after the bell last Monday. The market liked what it saw and heard with AA up close to 10% by the time the week ended. We also saw some major banks report their numbers with mixed results... Read More
ChartWatchers July 17, 2016 at 11:24 AM
Hello Fellow ChartWatchers! Are you a watcher of charts? By that I mean how much do you trust what you see on price charts? Do you trust the charts more than the commentary/opinion of others? Do you trust stories in the financial press more than what you see on the charts? The re... Read More
ChartWatchers July 17, 2016 at 08:46 AM
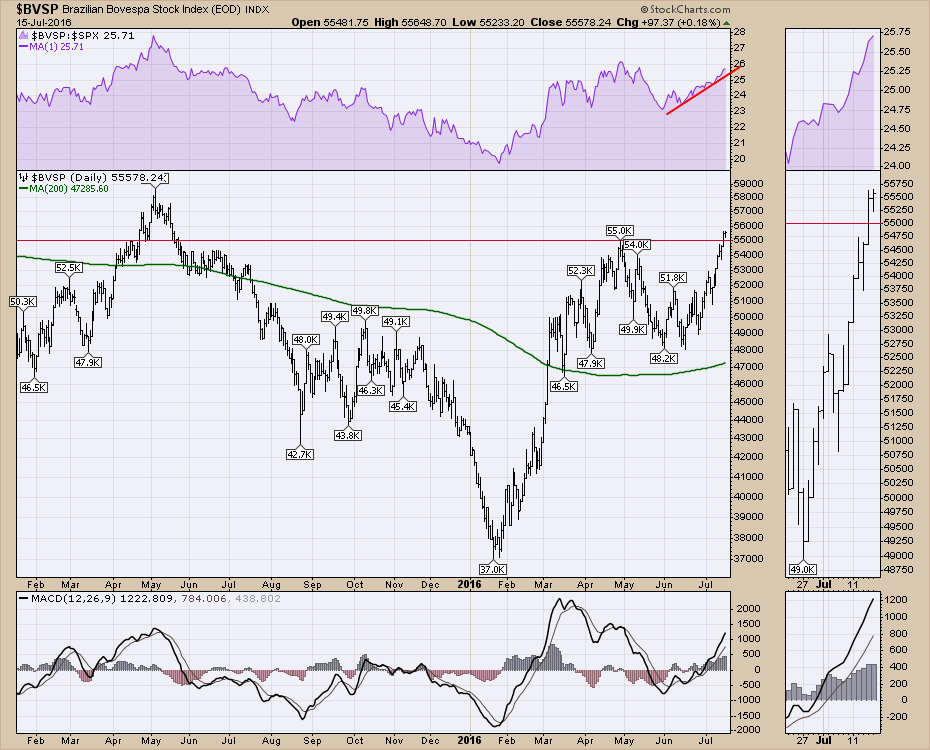
With the big push in the markets recently, global markets continue to break out to 52-week highs. Brazil hosts the world in three weeks with the Olympics... Read More
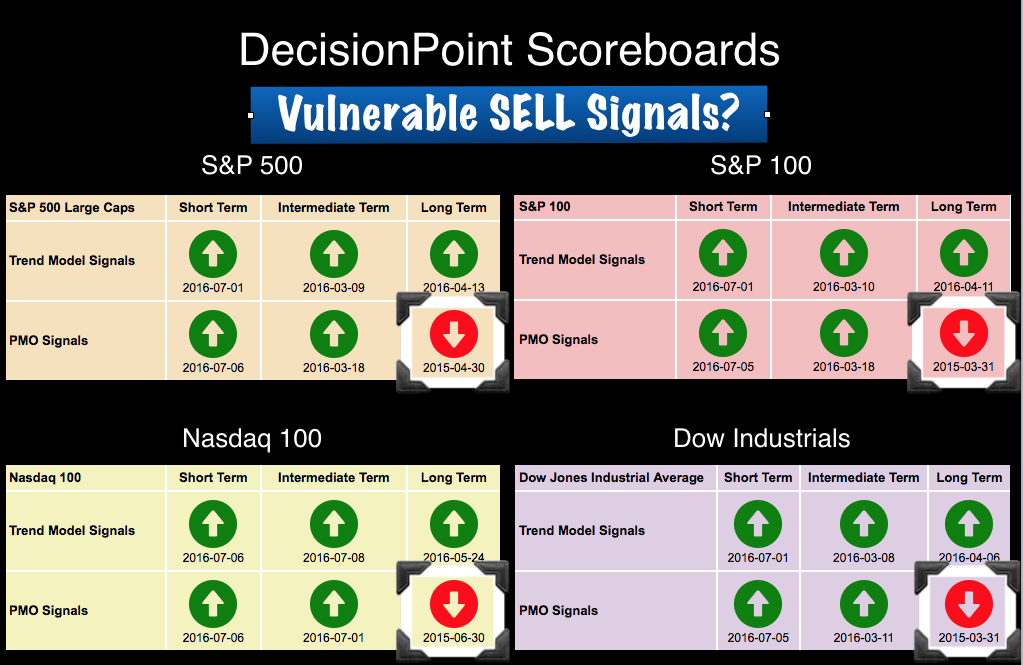
ChartWatchers July 15, 2016 at 09:47 PM
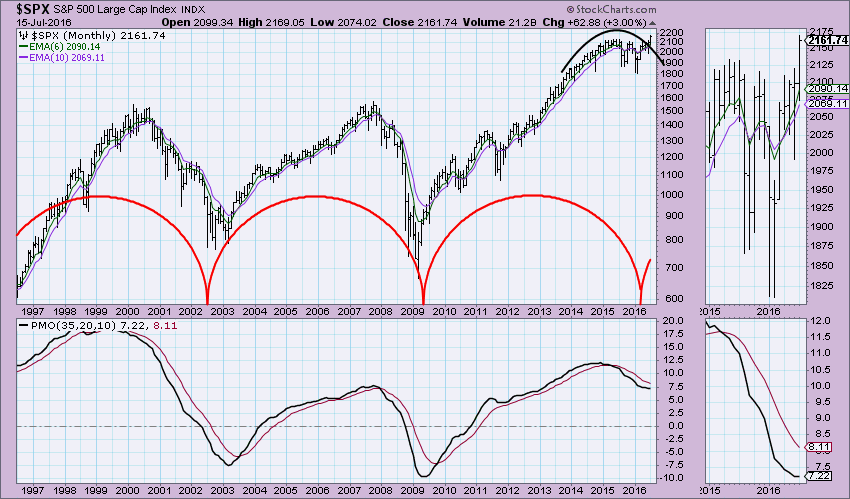
Let me first profess that I am not an avid follower of cycle charts. They generally take too much tinkering for my taste as they never quite fit over the long haul. However, as I was flipping through some of my longer-term charts, I ran into a chart I created last year... Read More
ChartWatchers July 03, 2016 at 03:18 PM
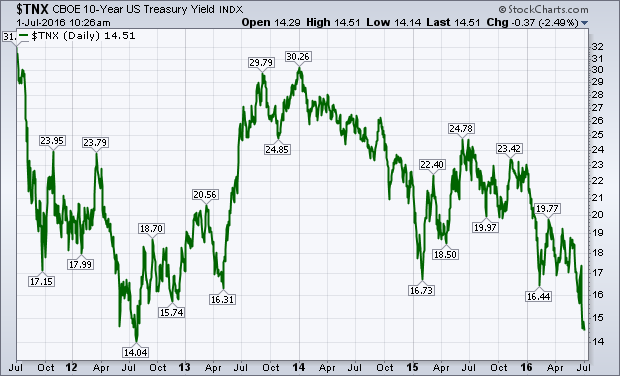
The plunge in global bond yields continues. Yesterday's statement from the Bank of England of its intention to lower rates sometime this summer pushed the British 2-year yield into negative territory for the first time, and its 10-Year to another record low further below 1%... Read More
ChartWatchers July 03, 2016 at 02:54 PM
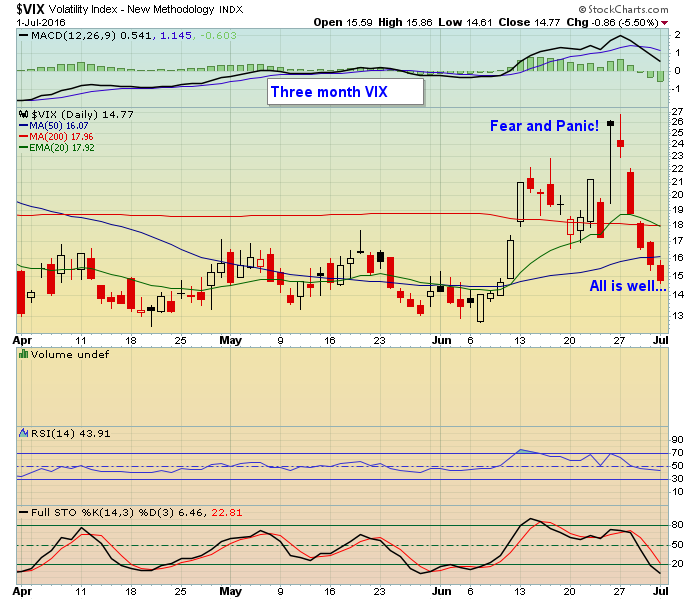
Exactly how bizarre has the market action been over the last six trading days? Let me count the ways. First, the British voted to leave the European Union which put the market in a tailspin with the S&P losing almost 6% in just two days... Read More
ChartWatchers July 03, 2016 at 10:16 AM
After a rough week where many traders sold on the news of Brexit, a four-day climb has taken us back to the highs before Brexit. This increases the weekly range and volatility, but interestingly enough, the market shocks all seem to come from offshore these days... Read More
ChartWatchers July 02, 2016 at 02:34 PM
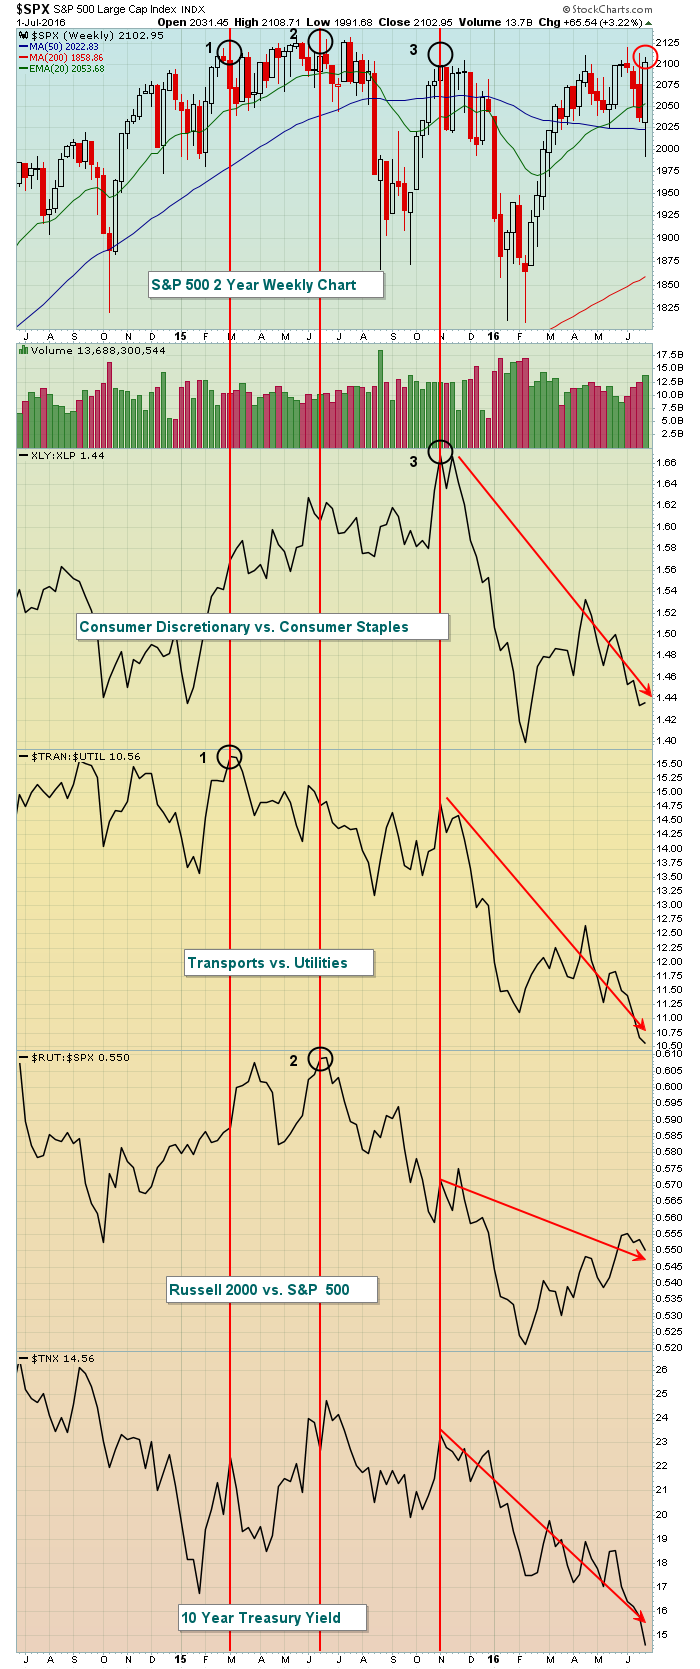
Here we go again. It seems as though every time the S&P 500 challenges the 2100 level and its all-time high close (2131), another aggressive area of the market falls apart and the rally is not sustainable... Read More
ChartWatchers July 02, 2016 at 03:25 AM
Chartists will look back at the long-term charts and try to figure out where exactly this big Brexit panic actually occurred... Read More
ChartWatchers July 01, 2016 at 08:08 PM
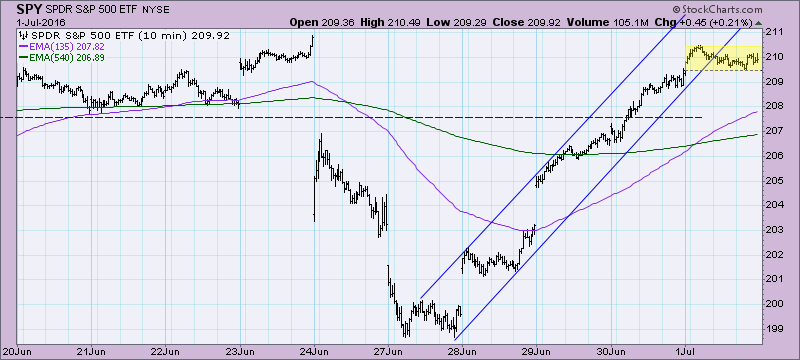
There is no denying it, the market experienced an amazing rally this past week after the waterfall correction initiated by Brexit. Now prices are where they were before the landmark vote... Read More