I spend a great deal of time scouring the market and looking for interesting trade setups. It's quite often that I see a stock that I really like, but it's not at a price level where I'm ready to pull the trigger. If I move onto the next chart, chances are that prior chart will be gone until.....I see it days or weeks later and it's made a big move that I was anticipating. Then it just becomes a wasted opportunity. So how can StockCharts.com make a difference?
ChartLists, that's how.
I couldn't trade any longer if I didn't have my ChartLists. It's so easy to quickly annotate and save a chart to a ChartList and it takes out all the memorization you have to go through to try to remember to keep an eye on a given stock, ETF or index. Or to have to return to scattered notes all over your desk. Planning, organizing and executing smart trades become a whole lot easier with very simple tools available right here at StockCharts.com.
Let me give you an example of a trade that I was able to uncover recently by using the ChartLists and Scanning tools. On September 21st, FedEx (FDX) had an excellent and very bullish reaction to its latest earnings report, but it wasn't a solid reward to risk trade until one month later on October 21st. Waiting a month to pull the trigger requires a ton of patience and discipline. I included FDX on a strong earnings ChartList and it turned up on two separate scans on October 21st that suggested FDX was a great reward to risk trading candidate.
First, let's go back in time and I'll show you what my annotated FDX chart looked like on September 21st:
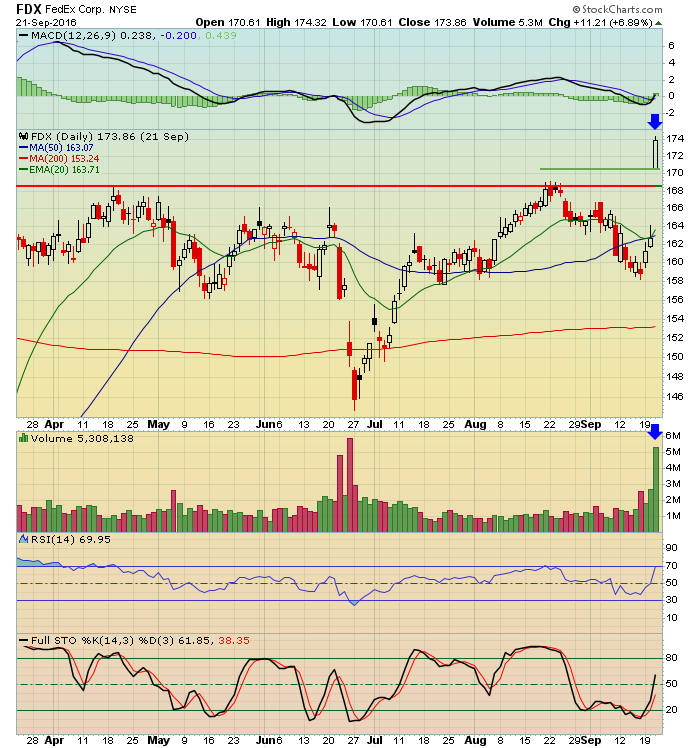 Earnings were awesome and clearly the reaction was quite positive. Volume was heavy to support a major breakout. But FDX quickly moved into overbought territory so I personally wouldn't chance chasing it at that level. Instead, I simply added it to my ChartList.
One month later, FDX began to surface on scans that I run every day. One scan was a 50 day SMA test that I run against that specific ChartList. On October 21st, FDX hit its 50 day SMA, its RSI had fallen back into the 40s and its chart looked like this:
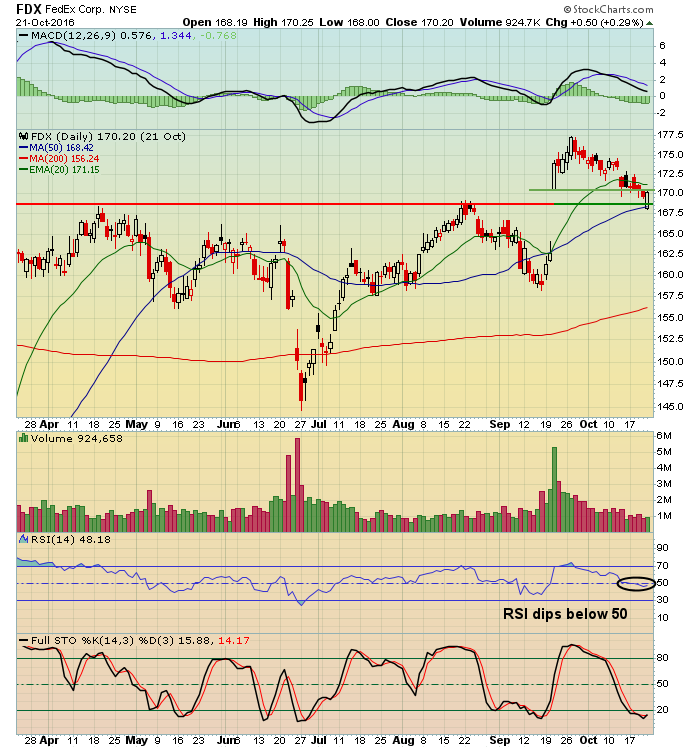 The price high had been 177.50 and that became my target. The opening price was 168.19 on October 21st and that was just beneath the rising 50 day SMA so I decided I'd keep a closing stop beneath that level. The reversing piercing candle that printed on October 21st was another bonus. Note also that volume was declining as FDX retreated off its earlier high.
The rest is history....
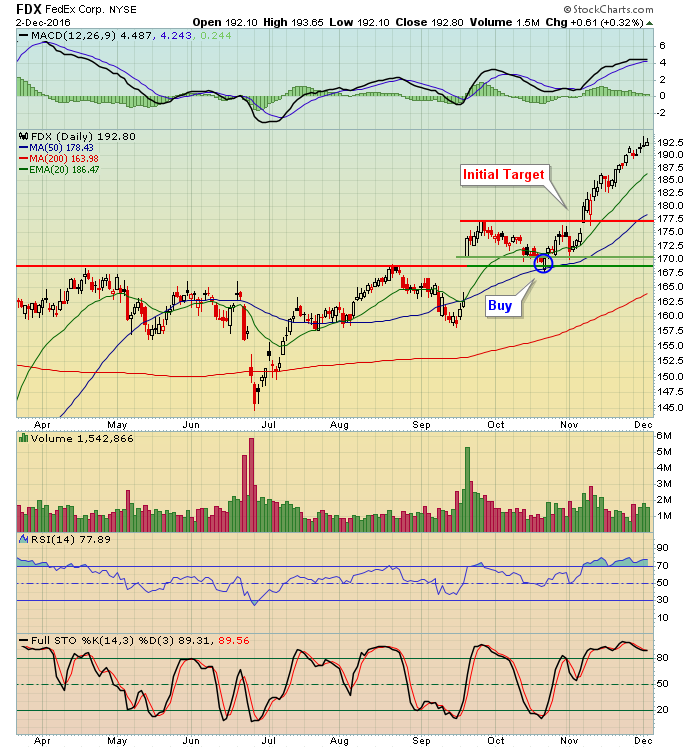 How long you decide to hold is up to you, but if I set a target, I generally find it's better to take the profits when they're available. We've all seen paper profits disappear from greed.
On Tuesday night, December 6th at 7:30pm EST, I will be joining John Hopkins, President of EarningsBeats.com for a joint webinar. I'll be demonstrating how to setup ChartLists and how to run scans against a specific ChartList, in addition to the technical merits of trading stocks that report better-than-expected earnings and a quick overall market view. I'd love to have you join me for this educational event. You can REGISTER HERE.
Happy trading!
Tom
