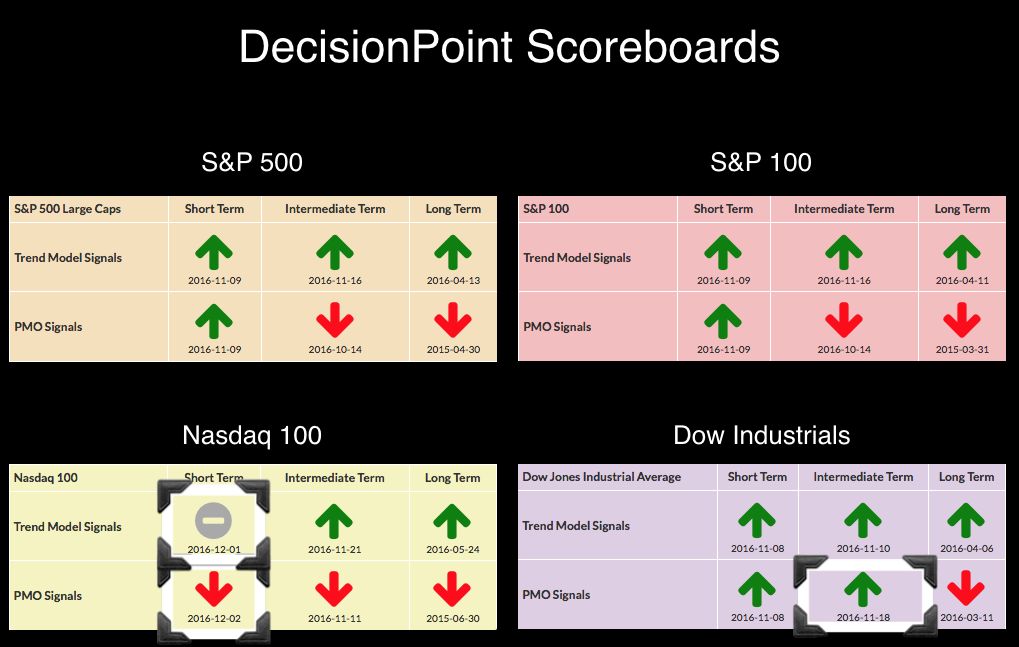
 The daily chart of the Nasdaq 100 doesn't really resemble any of the other large-cap indexes or even most small-cap indexes. Technology sectors have performed terribly. The Election "euphoria" enjoyed by the Dow Industrials and most other indexes really didn't do much for tech. Consequently, the NDX has triggered a Short-Term Trend Model Neutral signal and a Price Momentum Oscillator (PMO) SELL signal. A look at the DP Scoreboards below and it is quite clear the NDX is weakest and the Dow, the strongest. The Dow is the only index to manage an IT PMO BUY signal. I invite you to watch Friday's webinar where I review all of the daily and weekly charts for these indexes as well as small- and mid-cap ETFs, and the Dollar, Oil, Gold and Bonds.
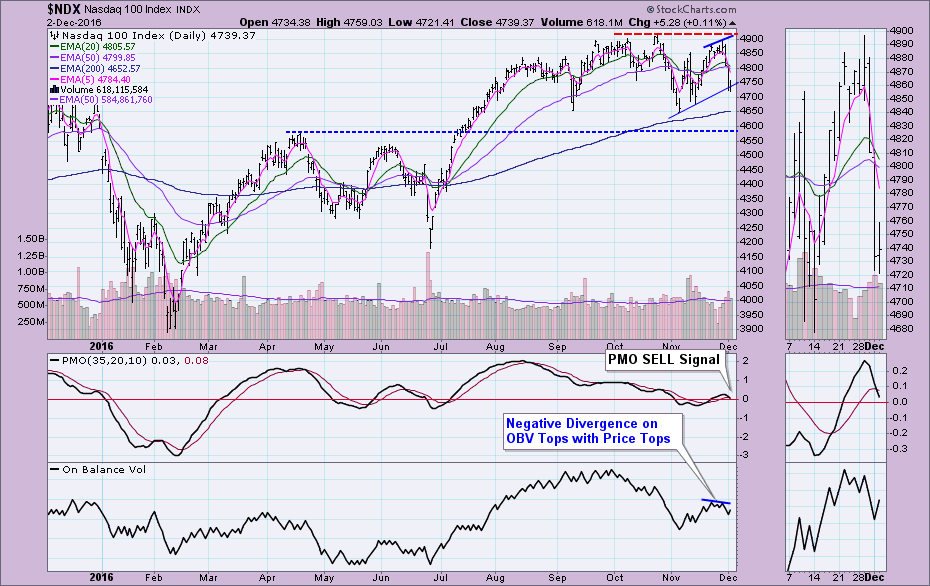
The daily chart for the NDX shows a somewhat weak rally in comparison to what you'll find on the chart of the Dow. Price was unable to significantly test the October high. The PMO SELL signal is visible. The Short-Term Trend Model Neutral signal was triggered when the 5-EMA crossed below the 20-EMA while the 20-EMA was above the 50-EMA (hence the Neutral signal and not a SELL). It's coming very close to an Intermediate-Term Trend Model Neutral signal which would generate when the 20-EMA crosses below the 50-EMA (Neutral because the 50-EMA is above the 200-EMA). This decline was signaled to us with the negative divergence between OBV tops and price tops on Wednesday's drop.
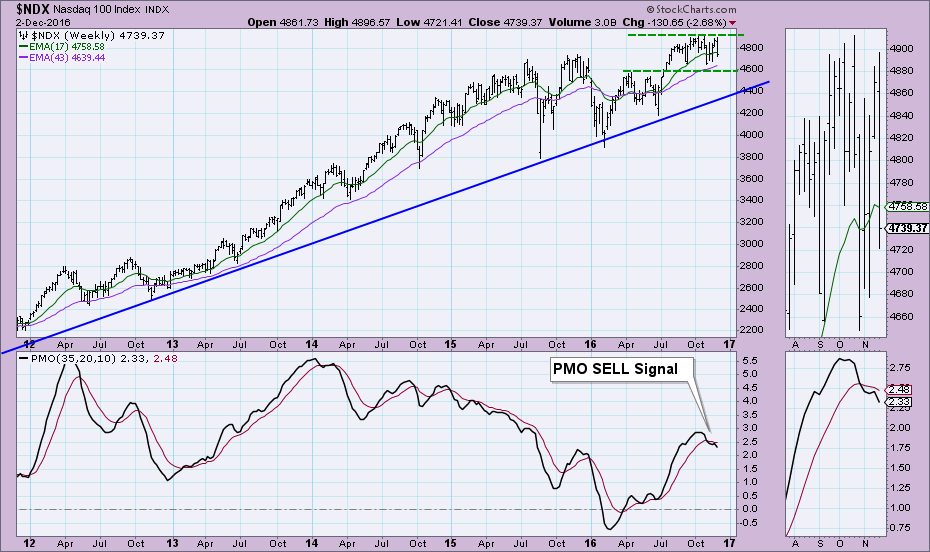
The intermediate-term picture shows last month's weekly PMO SELL signal and the numerous unsuccessful tests of resistance around 4900. Good news is support is at 4600.
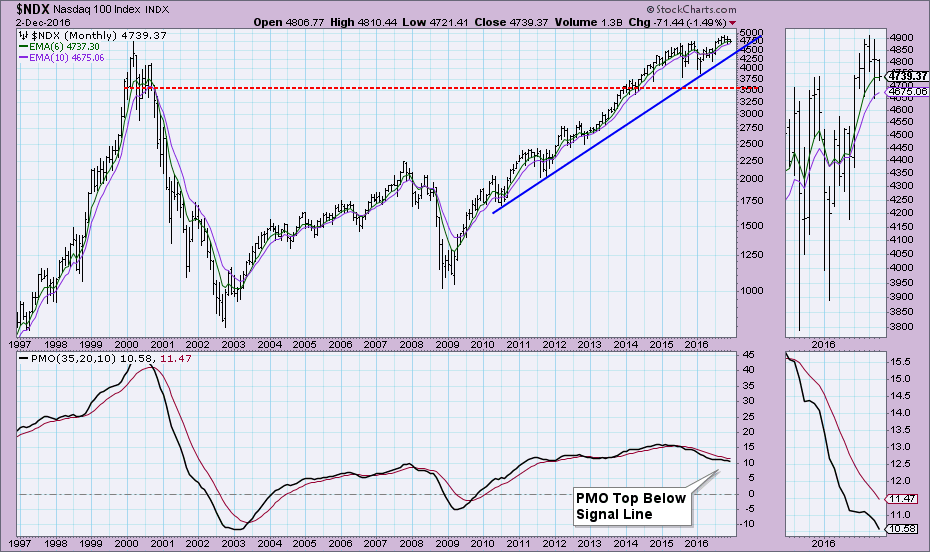
The monthly PMO turned down below its signal line and is headed lower which is very bearish. The rising bottoms trendline has managed to provide strong support. If that holds, it confirms the NDX support level of 4600 in the weekly chart above.
Conclusion: It is troubling to see the NDX so weak. A strong bull market should have support from all of the large-cap indexes (and most of the small ones too).
The NEW DecisionPoint LIVE public ChartList has launched! Click on the link and you'll find webinar charts annotated just before the program. Additional "chart spotlights" will be included at the top of the list. Be sure and bookmark it!
Come check out the DecisionPoint Report with Erin Heim on Wednesdays and Fridays at 7:00p EST, a fast-paced 30-minute review of the current markets mid-week and week-end. The archives and registration links are on the Homepage under “Webinars”.
Technical Analysis is a windsock, not a crystal ball.
Happy Charting!
- Erin