Exercising patience and discipline to enter trades at appropriate reward vs. risk levels is obviously very important to any trader's success, but planning trades before they set up is just as important. Let me give you a few examples. First, let's take a look at Cullen Frost Bankers (CFR):
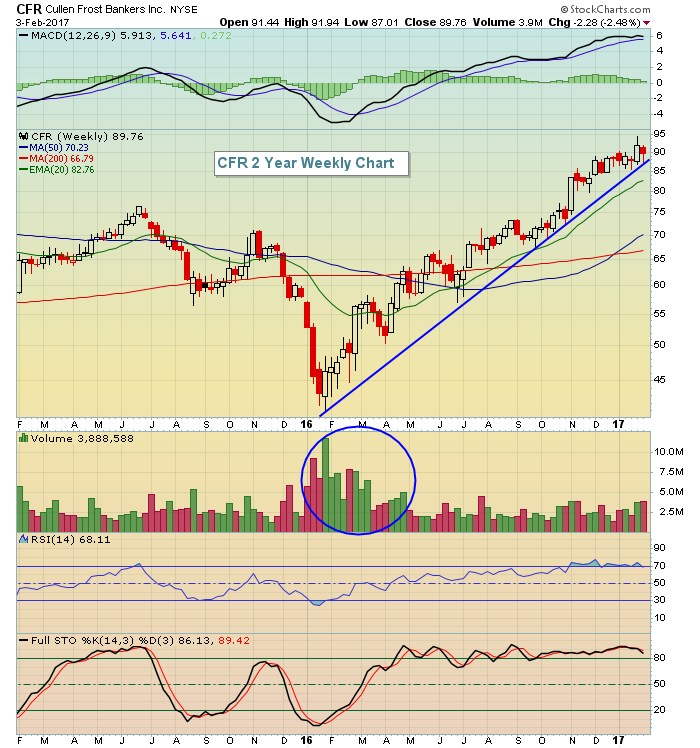 Trendlines are only as strong as the number of price points that are connected. You can always connect two price points and highlight a trendline. But those cannot be relied upon to hold as support. As you test a trendline more and more times, that trendline becomes very important. CFR began a parabolic rise a year ago after breaking a prior downtrend and that trendline represents excellent support - until it's broken.
A second example is F5 Networks (FFIV). This stock combines examples of both trendline and price support. Check out the chart:
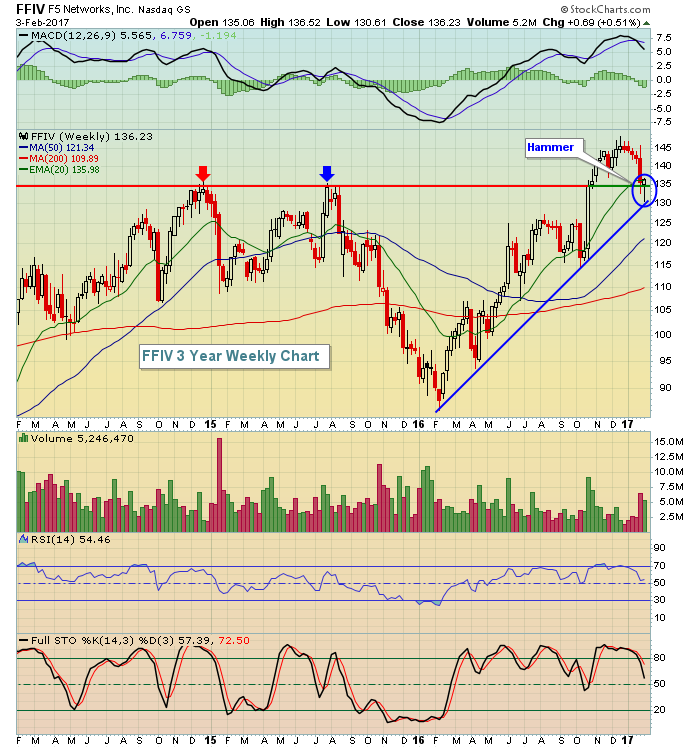 Last week, FFIV sold off to test its rising trendline for the fifth time since bottoming a year ago. The 130-135 range is very important for price reasons as well. Check out price resistance (red arrows) prior to the October breakout. Note that last week's candle formed a hammer right at price support after testing trendline support. The close was almost squarely on the rising 20 week EMA as well. The current price level represents a great reward to risk entry with minimum hopes of a retest of recent price highs. Trendline support would be a solid closing stop level.
Let's move on to a stock that's been downtrending, but is currently threatening a breakout above both trendline and price/gap resistance. Check out the daily chart on CCI first:
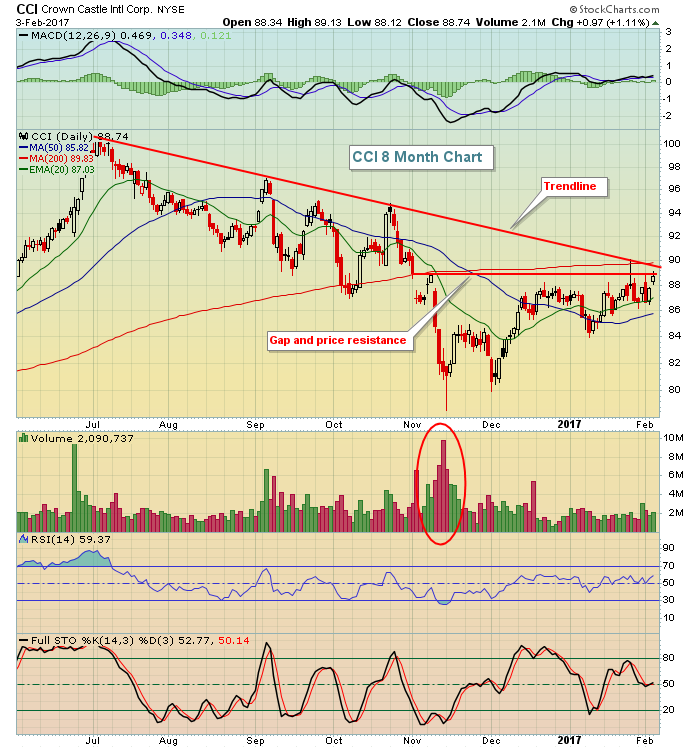 At first glance, CCI looks quite bearish. The downtrend line is obvious. Volume on the gap down was extremely heavy, indicative of distribution. What is there to like? Well, not a whole lot on this daily chart. But let's move to the bigger picture chart - a 3 year weekly chart:
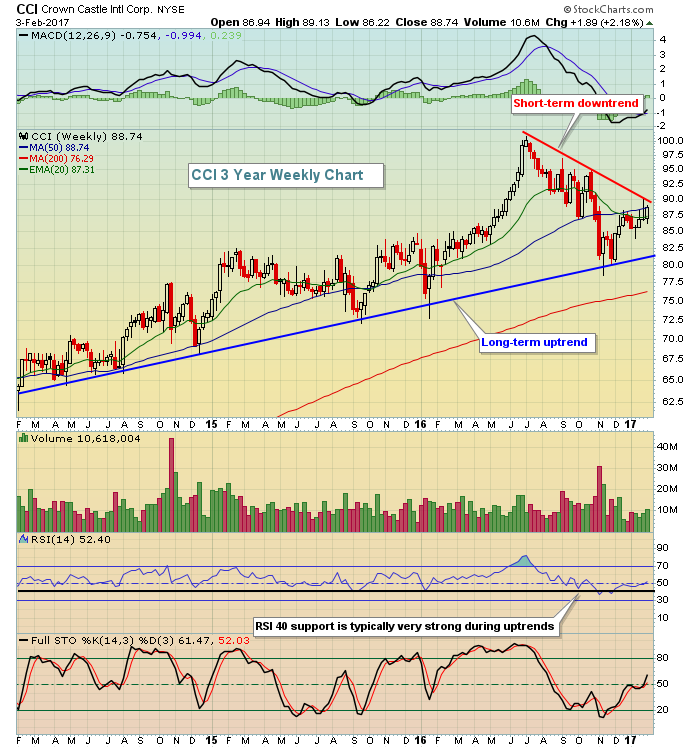 That short-term downtrend line is still quite apparent, but the overall chart pattern remains very bullish in my view. In fact, I'm watching CCI for either a heavy volume breakout above trendline resistance (red line) or for a pullback to test the rising trendline (blue line).
Happy trading!
Tom
