It seems that nothing is ever easy in the market, but following price action is really important as we know.
Following the November 1-2, 2016 Federal Reserve meeting, Banks (Financials in general) went ballistic as it looked very probable that the Fed would raise rates at the December meeting. Coinciding with that was the election of President Donald Trump a week later. It is important to note that the rally in Financials started before the election and ended on the next Fed meeting December 14th shown in the chart below. The December Fed meeting, the January Fed meeting and the May Fed meeting all had the KRE at the same level. The March meeting had a 2% gain above the December meeting but gave it back.
Looking back to the September 2016 period, the banks had been in a slight trend of higher highs and higher lows between the September Fed meeting and the November Fed meeting. I have shown that on the chart below. Shortly after the November Fed meeting, the financials and the broad market pulled back for a day or two, then accelerated higher with the $SPX gaining 60 points off the lows before the US presidential election.
Currently the Financials are in the same sort of mild uptrend of slightly higher highs and lows between the March and May Fed meetings. This 2 day post-Fed setup has just happened again. The Friday close saw the $SPX have a sudden surge to new closing highs on Friday to set up the next week which is a little different.
While the outcome of the French election will also be known on Monday, the setup for the banks to go higher here looks similar to just after the November Fed meeting. There are two sideways days in the Bank ETF KBE after the Fed meeting. Do we get an explosive move higher on French results or Fed results?
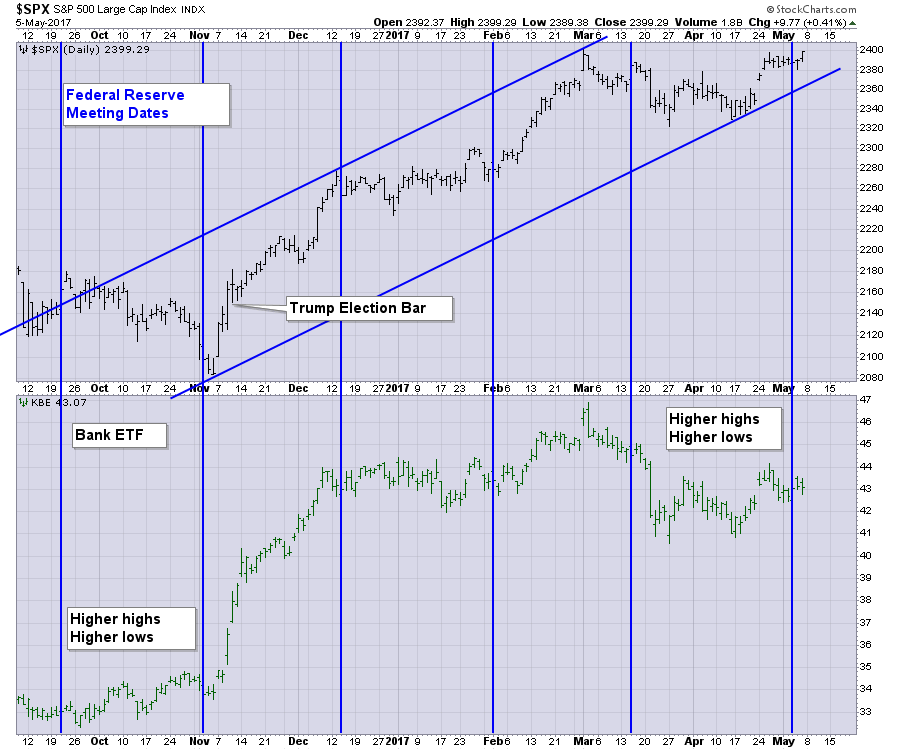
To sum this up, the Banks have been out of favor since the December Rate hike. The KBE ETF closed out on December 13th at $43.17 before the December announcement. It closed Friday May 5th at $43.07 which is 5 months with flat results as the $SPX rallied without the banks to an all time closing high Friday. How long will that continue?
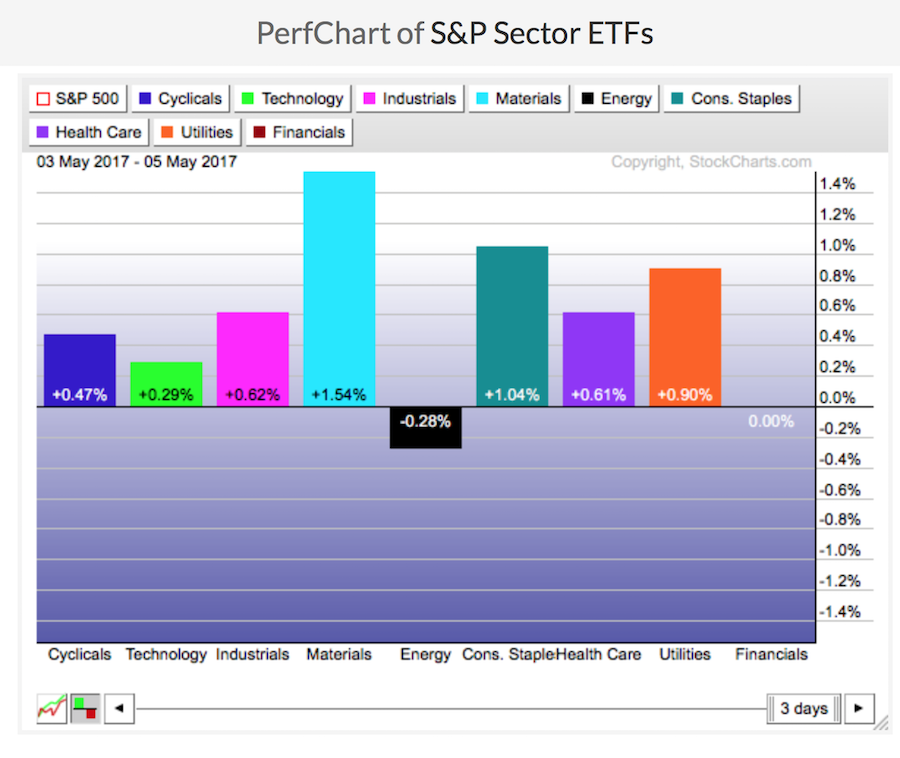
Since the Fed meeting two days ago, the financials have been the second-worst performing sector. They were flat in a rising market. I am not sure I would have picked Technology, Energy and Financials to be the worst performers on the back of the Fed.
The bottom line here is that the setup for the banks to rally under the cover of the French election might be hiding the fact that they have a lot of catching up to do.
I think watching the KBE and the KRE (regional banks) over the next couple of weeks might be a good place to focus our attention. Similar setups are in play. We'll see if it plays out that way.
There were lots of massive moves in Commodities over the last few weeks. The one hour videos summarize a lot of the information. You can catch all of the Commodity Countdown and Canadian Technician videos in one place now. Greg Schnell Video Recordings. I also keep up a chartlist that you can view anytime. Commodities Countdown Chartlist. If you like Twitter, you can follow me @Schnellinvestor. Thanks for tuning in!
PS. Some great industry colleagues write in the Top Advisors Corner. David Keller, CMT just published his first article there. Check out his article and send him a note! It is truly a great place to look for additional interesting commentary as well as our main blog articles.
For the educational segment:
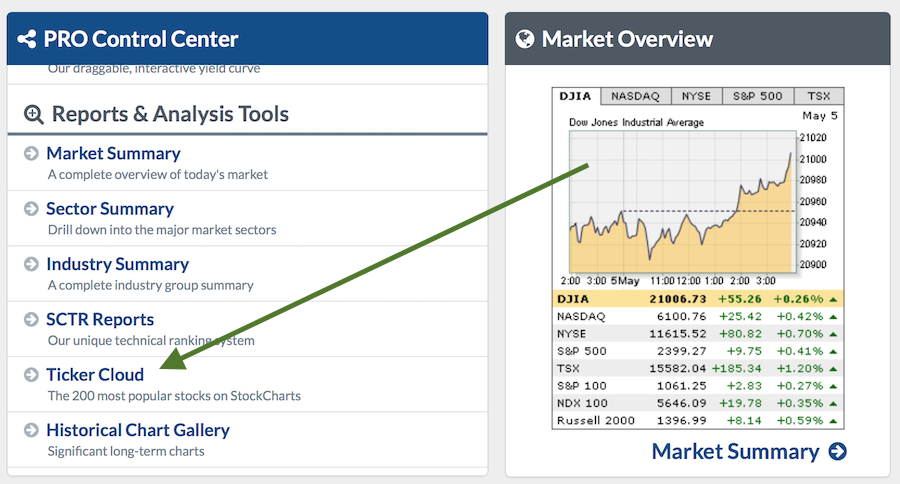
If you like the Ticker Cloud at StockCharts as much as I do, it is under the Control Center column on the Members Tab. The Ticker Cloud looks like this:
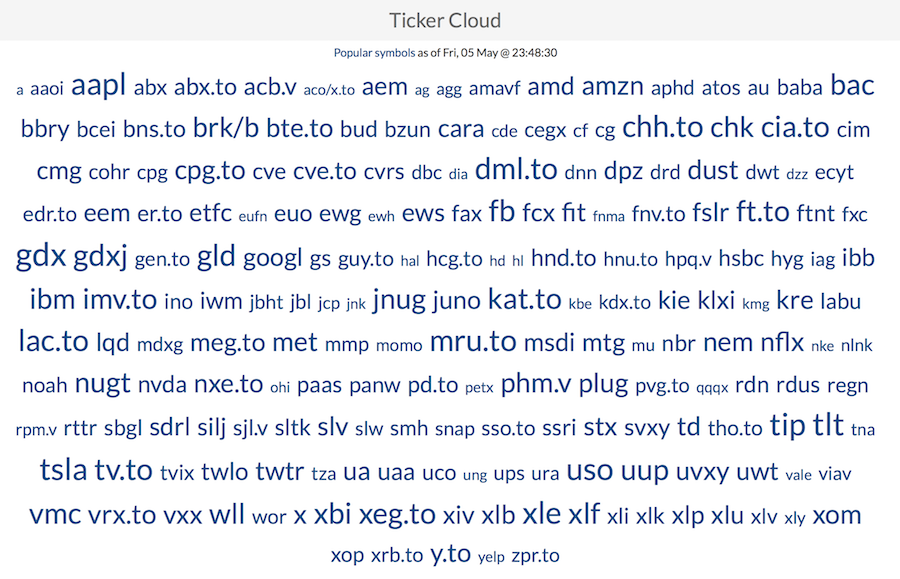 That is my goto place to see the main tickers as well as interesting ticker symbols you might not have seen before. Again, it is under the Control Center column on the Members Tab.
 I'll try to publish additional educational segments within my blog articles highlighting a lot of the layout changes. If you would like to turn on all these fantastic StockCharts features, try a 30-day free trial! The video recordings also show you ideas on moving around the site, so grab a coffee and catch a fast paced hour of commentary at the Vimeo library.
Good trading,
Greg Schnell, CMT, MFTA