 The S&P 500 is in the midst of a big run that lifted most boats, especially financial stocks. Even though these stocks are leading with the biggest gains over the last three weeks, most big financials are still in downtrends overall and below their 200-day SMAs.
Take Citigroup for example. Even with the big surge, Citigroup remains below its November-December highs and nowhere close to a new high. The stock has merely returned to the breakdown zone in the 65 area. This suggests that it is more pretender than contender. True contenders (leaders) are above their November-December highs and near new highs.
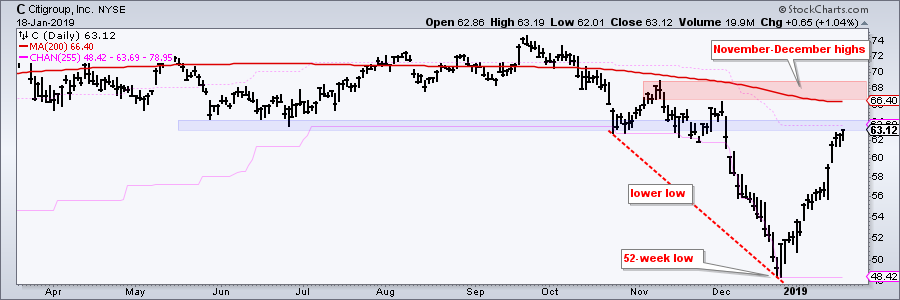 Chartists looking to separate the true contenders from the pretenders should focus on three price points: the relationship between the October-December lows, the November-December highs and the 52-week high.
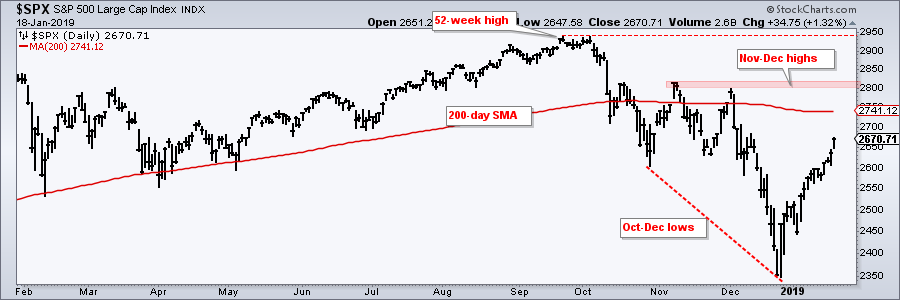
Stocks that formed higher lows from October to December showed relative chart strength during the market meltdown (Citigroup did not). Note that the S&P 500 exceeded its October lows in December. Stocks that subsequently broke above their November-December highs are outperforming on the upside (Citigroup has not). $SPX remains well below these highs. Stocks at or near a 52-week high are leading and in uptrends. $SPX is not even close to a 52-week high, neither is Citigroup.
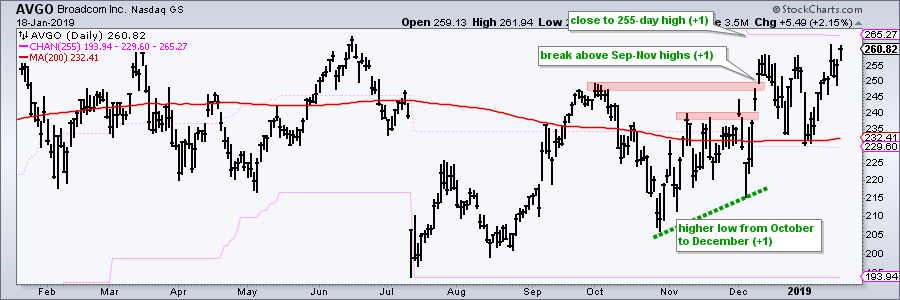
And then there is the hat-trick: stocks that held above their October low in December, broke their November-December highs and traded near 52-week highs recently. These stocks are the true contenders.
The example below shows BroadCom (AVG) with a higher low from October to December (+1). Next, the stock broke above the September and November highs (+1). And finally, the stock is within 2% of a 255-day high, which is equivalent to a 52-week high. Three for three looks like a hat-trick.
On Trend on YouTube
Rising Wedges and Resets
- 50-days in Play as Breadth Wanes
- Rising Wedge is Bullish Until it Ain't
- Resetting Key Levels for Big Sectors
- Retail, Housing and Semis Weaken
- Bonds, Gold, Silver and the Dollar
- Stocks to Watch (CVX, GOOGL, INTC, QCOM)
- Click here to Watch
Separating the Signal from the Noise
- Big Breakdown vs Zweig Thrust vs Resistance
- Overbought Indicators and Waning Breadth
- Watching the Windups (XLK, XLV, XLC, GLD)
- Pullback for Treasuries and Surge in Junk
- Comparing the Bounce using Stochastics
- Stocks to Watch (KR, RMD, SBUX, TWLO)
- Click here to Watch
- Arthur Hill, CMT
Senior Technical Analyst, StockCharts.com
Book: Define the Trend and Trade the Trend
Twitter: Follow @ArthurHill