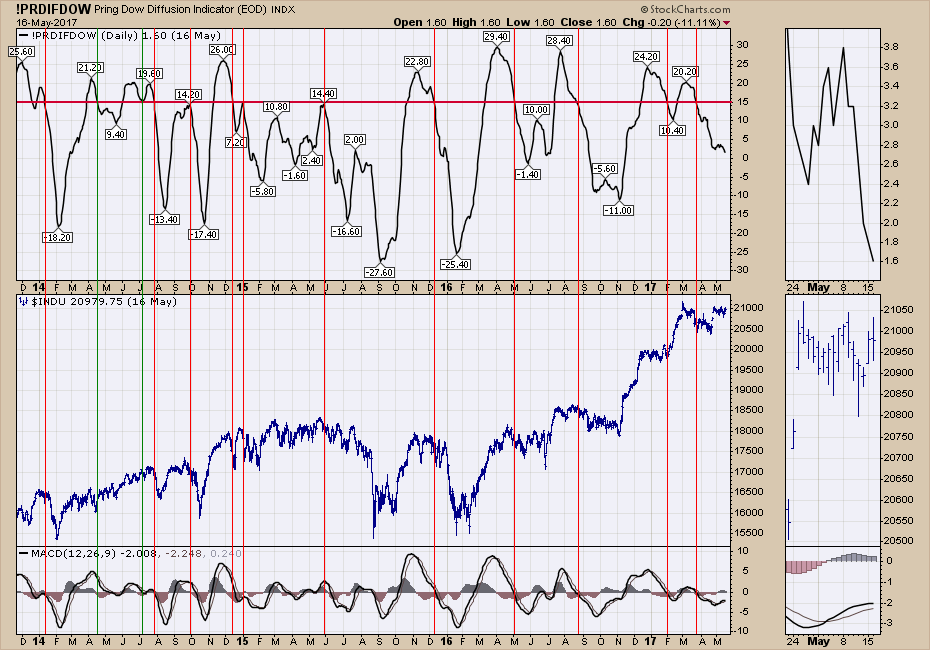
Martin Pring's trusty Dow Diffusion Indicator (!PRDIFDOW) has been dripping lower lately. A few people have asked to see more on this indicator so I thought I would share it in a blog rather than a video. If you would like the video version, I covered it on the Canadian Technician Video Recording 2017-05-16.
First of all, the Dow has 30 components. So the minimum and maximum on the scale is 30 and -30. The Dow Diffusion Indicator monitors the number of stocks in a rising or descending trend. When it gets below 15, The Dow can move higher but there is not a lot of breadth to the move. When it is below zero, the Dow usually declines. Remembering the size of Apple, it is pretty dominant, and the other large cap technology stocks in the Dow have been very supportive. Apple, Intel, Microsoft and Cisco, have all been moving pretty good. When the diffusion indicator drops below minus 15 (-15) and starts to turn up, its a pretty good buy signal. The November dip only made it to -11. This is updated End of Day (EOD) so watch to see if it goes below zero.
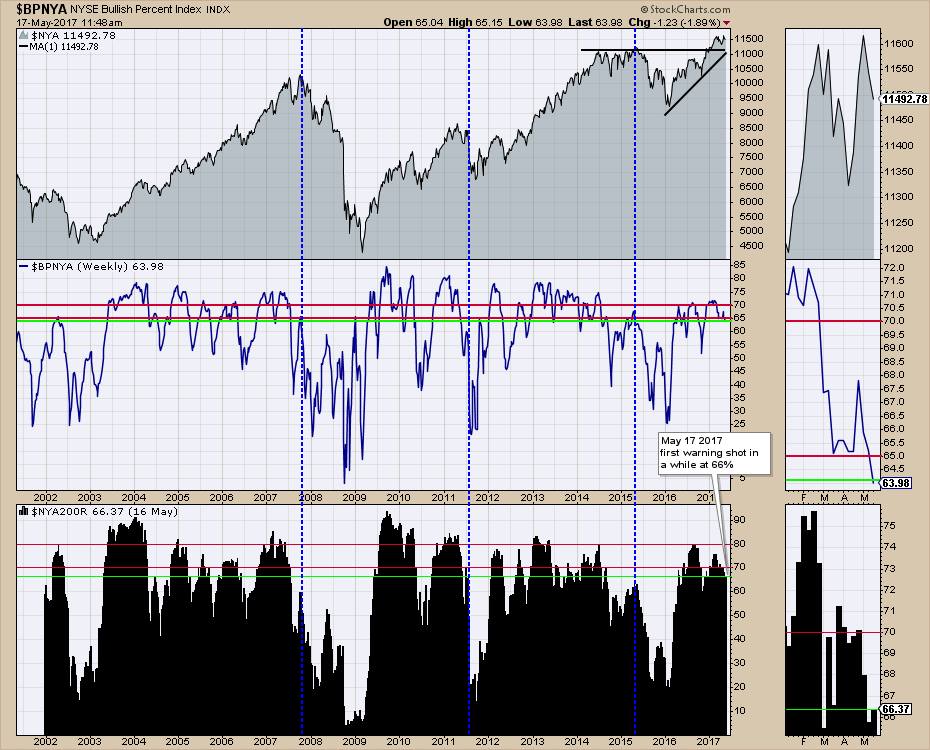
Next up are the broad breadth indicators for the $NYSE and the Nasdaq.
On the charts below, the green lines are the current levels. We are mid-week so we need to wait for Friday to finalize the levels on a weekly chart. The percentage of stocks above the 200 DMA ($NYA200R) shown in the lower panel is still at 66%. Levels below 60% usually lead to a decline. The Bullish Percent level ($BPNYA) is usually a little later on a reliable signal, but below this 70% level is usually troublesome for the NYSE Composite ($NYA).
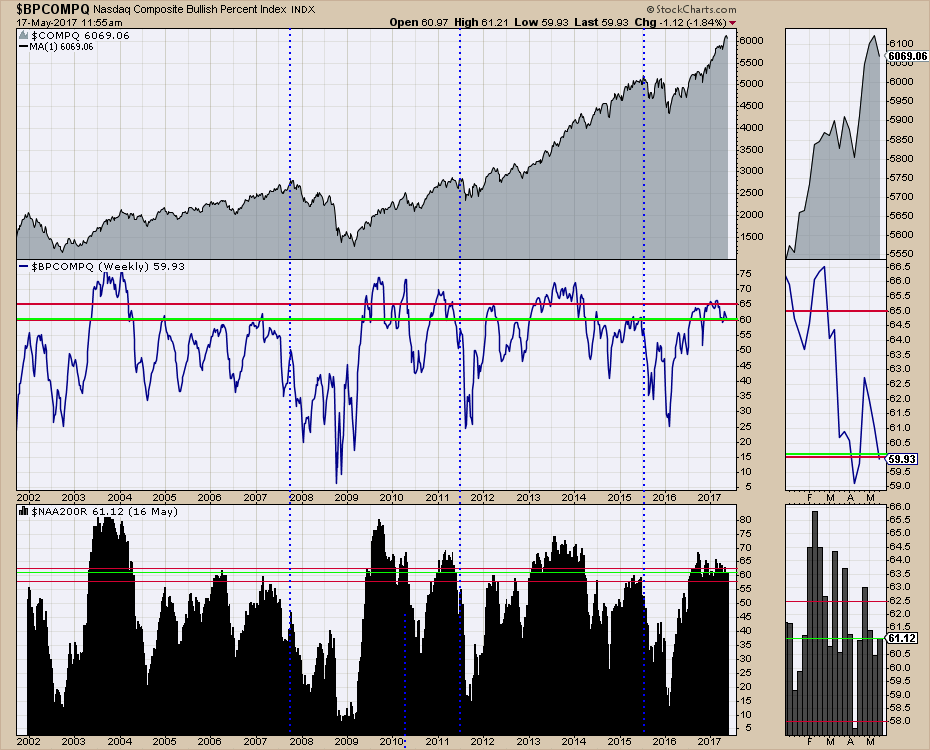
 For the Nasdaq, it looks weaker but it usually does. I have estimated a level of 58% for the percentage of stocks above the 200 DMA as being the critical level looking left on the chart. With a reading of 61%, we are getting close. The level of 60% on the Bullish Percent Index ($BPCOMPQ) is critical and we are there now. In April we briefly dipped below only to surge back higher again. These charts update all the time, but the weekly close will be important with Options Expiration on Friday.
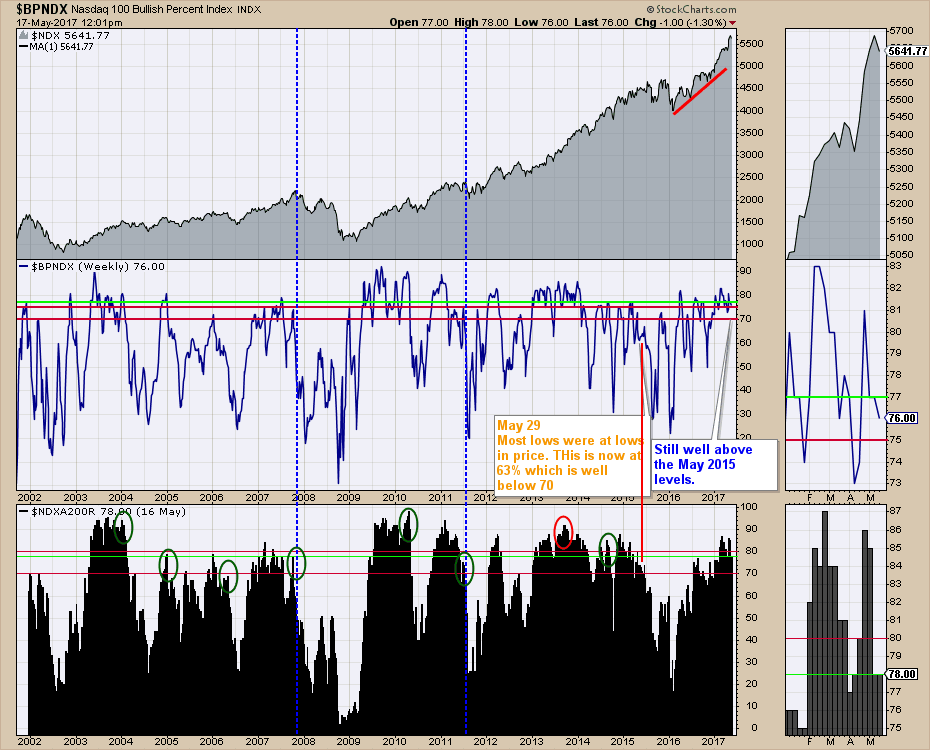
 The Nasdaq 100 components have been very strong and guiding the market higher. This still looks strong but it is usually the last index to break down. The Bullish Percent for the Nasdaq 100 is $BPNDX. The level of 70% is an important level, or even as low as 67% or 2/3rds of the index. At 76, it is still quite strong but it continues to deteriorate since February. The Percentage of stocks above the 200 DMA is still at 78% which is 8 to 10% above the inflection point.
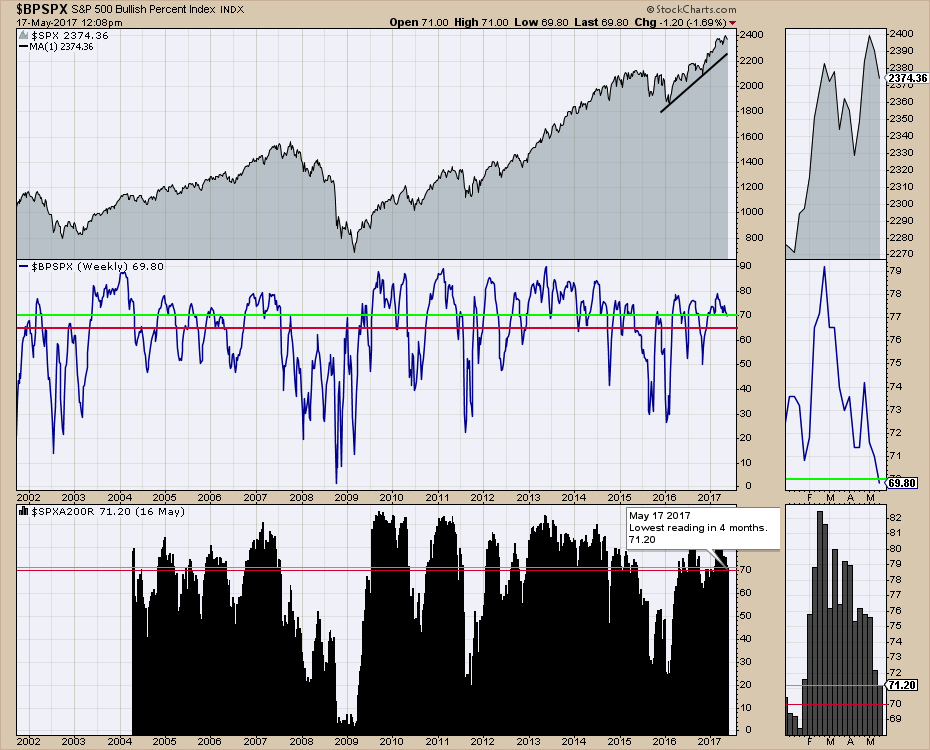
 The $BPSPX is quite resilient. When it stays above 65% the market can continue to climb. The large cap technology companies also influence this index so the market really has to break down broadly to pull it back. The Bullish percent at 69.80 is still quite robust. The Percentage of stocks above the 200 DMA is getting to a level of 71 whereas my threshold is 70%. Any further weakness in breadth would probably cause a deeper pullback. We'll await Friday's closing data.
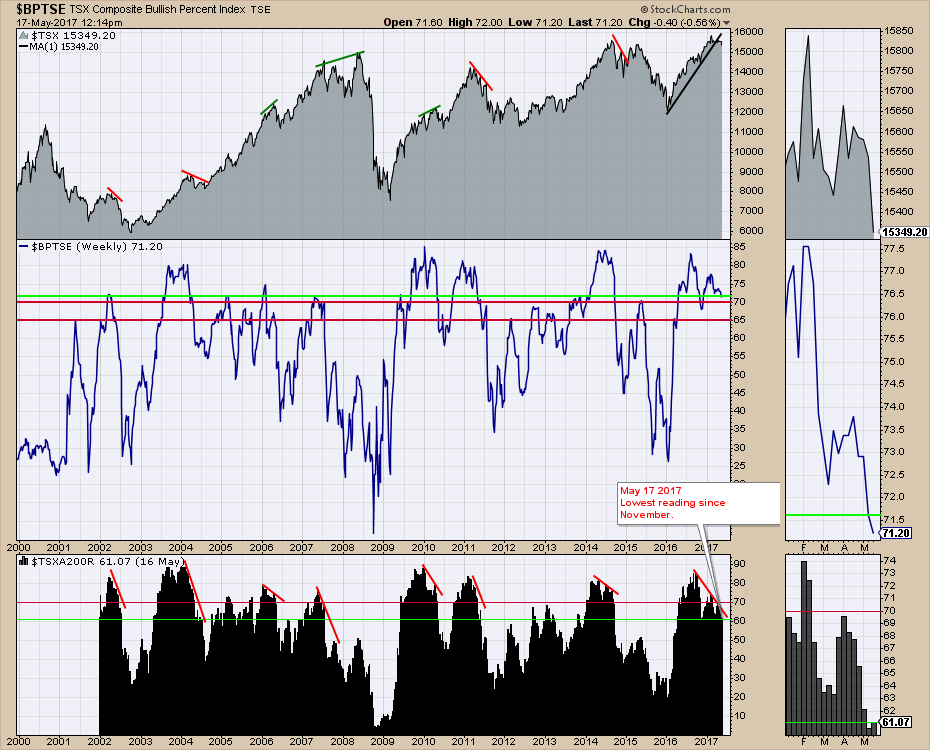
 For the Canadians, a couple of charts are at critical levels. The percentage of stocks above the 200 DMA is at 61% which does not bode well. This is the weakest reading in a year and looking left on the chart, you can see that 60% is a must hold level. After this, the market seems to drop rather quickly. The Bullish percent indicator is usually late on a sell signal, but we have been above the critical level of 65% for a year.
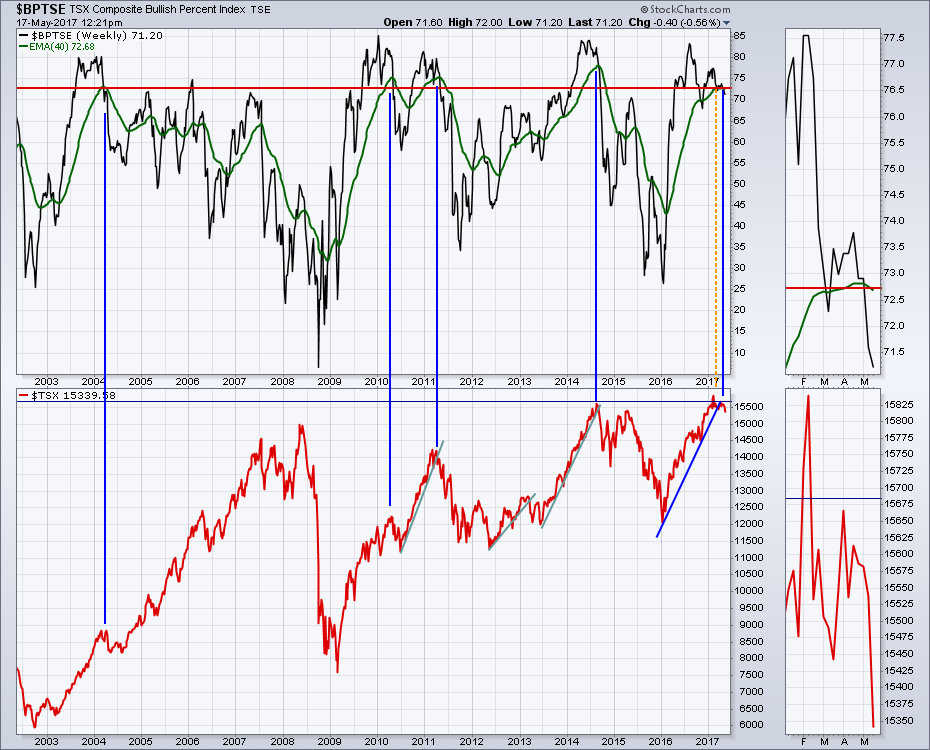
 Lastly, the 40 WMA on the Bullish Percent indicator is a pretty good sell signal when coming off really high levels.We can see most signals generated above the red line resulted in meaningful sell signals. The one whipsaw was the March low. Will we be lucky enough to get two whipsaws in a row? I wouldn't want to bet on that.
 The bottom line is the market breadth signals are deteriorating. While they are not at breakdown levels yet, they do suggest protecting the profits you have made if there is more to come. It is nice when the signals come in while the market is near the highs. I have been saying for a while that there is lots of breadth. We still have some room for further weakness. At least we can make some decisions on protecting profits over the next few days if you are a swing trader.
Good trading,
Greg Schnell, CMT, MFTA.