 Using the pattern identification philosophy developed in the previous article on Pattern Identification, one can now adapt a method of determining just how successful candle patterns are? The techniques I used are quite analytical and I find they are somewhat difficult to explain, so here goes.
Measures of Success
The following three assumptions were used in measuring the success and/or failure of the many different candle patterns:
1. The pattern must, of course, be identified based upon its open, high, low, and close relationships (see previous article).
2. For the pattern to be identified, the trend must be determined (see Trend Determination article). This is interchangeable with the previous assumption; each must exist in the methodology.
3. Some basis of measurement must be established to determine the success or failure of the candle pattern.
To make a creditable prediction, you either know the current trend of you do not. Both assumptions and possibilities have been used here.
The Trend is Known
Candle patterns fall into two general categories: those that indicate a reversal of the current trend and those that indicate trend continuation. Each day (for each security), a prediction is made about whether the known trend will continue or reverse for each prediction interval. In other words, if today’s close is above the exponential average (trend), then we assume that we are in an uptrend. The success or failure is measured by the change in this trend over the prediction interval. The prediction interval is the number of days into the future the success or failure was based upon. Prediction intervals refer to the time periods between the actual candle pattern and some point in the future. All of the results in my analysis uses daily data (versus weekly or intraday data) for the time intervals. I am adamantly opposed to using weekly or intraday data in candle pattern analysis – see this article. The periods into the future were 1 through 7 days.
When a candle pattern occurs, it is offering a short-term forecast on the direction of the underlying market. The prediction interval is the number of days after the candle pattern that a determination is made as to whether or not the candle pattern was successful. A prediction interval is a time in the future that measures the candle pattern’s forecasting ability.
Once a trend starts, the odds are that it will continue. Every student of science or engineering will recognize that this is nothing more than Newton’s First Law of Motion, which says, a body continues in a state of rest or of uniform motion in a straight line unless it is compelled to change that state by forces applied to it. Simply said, it is easier for a market to continue its direction than to reverse its direction. Remember that, it will be brought up again. Therefore, the continuation of a trend is more common than the reversal of a trend. Remember, we are talking about the short-term future here.
If, at the prediction interval, the price is still above the trend, then the candle pattern (continuation) was successful. Simply said: if, during the prediction interval, we are still in an uptrend, then it was deemed successful (Figure A). If not, it was a failure. Figure A graphically shows the relationship of reversal and continuation patterns with the prediction interval. The relationship of pattern type with prediction interval is based upon the fact that the trend is known. You can see that the predictive ability improves over time for reversal patterns and gets worse over time for continuation patterns. Stop and think about that and it will make perfectly logical sense. A continuation pattern is saying the very trend that helped to identify the pattern is going to continue. A reversal pattern is saying the very trend that helped to identify the pattern is going to have to reverse.
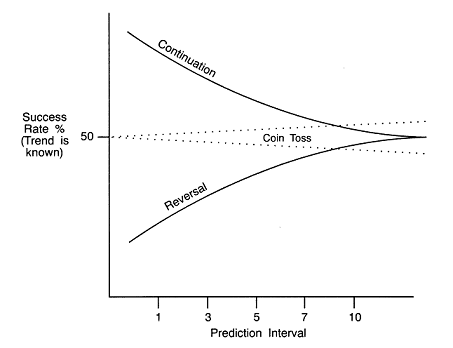 Figure A
The Trend is Not Known
Sometimes you do not know what the trend is before making the prediction. In such cases, a coin-toss type of prediction is made about whether the price will go up or down. If you do not know the trend, the odds of its continuing or reversing would fall into the area of 50%. The difference above or below 50% would reflect the directional bias of the data used in the analysis. Again, the success or failure is based upon the price at the prediction interval relative to the change in trend. This fact is also shown in Figure A above. Remember, almost all candle patterns require that the trend be identified.
Reverse Current Trend and Continue Current Trend
From the computer calculations, two primary parameters are determined: Reverse Current Trend and Continue Current Trend. These are further broken down into Up and Down trends (i.e., Reverse Current Trend Up and Reverse Current Trend Down).
The sum of Reverse Current Trend success and Continue Current Trend success will be equal to the number of days of data used in the testing process. Since a prediction is made each day, Reverse Current Trend success and Continue Current Trend failure would be equal. In other words, the success of Reverse Current Trend, is also the failure of Continue Current Trend. I know what you’re thinking, but stick with me.
Reversal candle patterns (which most are) are compared to Reverse Current Trend and further broken down into upturns and downturns. Since reversal candle patterns must go against the very trend that defines them, their measure of success would not be as rigid as that of a continuation candle pattern. In fact, their measure of success could actually be less than that of a coin toss, since they are predicting a change in the current trend, a trend which is supposedly known.
Likewise, continuation candle patterns are compared to Continue Current Trend. Continuation candle patterns say that the trend that helped define them is going to continue. Therefore, for a continuation candle pattern to be considered successful, it must do better than the success of knowing the trend in the first place. Because we know the current trend and we know that the odds are that the current trend will continue; to be useful, continuation candle patterns must be exceptionally good, or are no better than the trend-identification process.
So, here is the message I want you to understand. A reversal candle pattern is calling a reversal of the very trend that was used to identify it in the first place. It has to be a good reversal pattern to overcome this. Whereas a continuation pattern is merely saying the trend that was used to identify it is saying that trend will continue. Future articles will show some of the statistics from all my analysis.
Dance with the Trend,
Greg Morris