 The following tables of data reflect the performance of 14 different technical indicators using the perceived popular parameters for each one (see Table A). However, each table uses a different setting for analyzing the candle patterns. The success or failure of a candle pattern is determined by the price relative to the last day of the candle pattern. For example, in Table B, the success of a candle pattern is measured by the price two (2) days after the pattern. If the price is lower and it was a bearish reversal pattern or a bearish continuation pattern, then the pattern was deemed successful. Similarly, if the price was higher for the bearish reversal or bearish continuation pattern, then the pattern was a failure. Stated a little differently, if the candle pattern was correct after the period being used, it was considered successful.
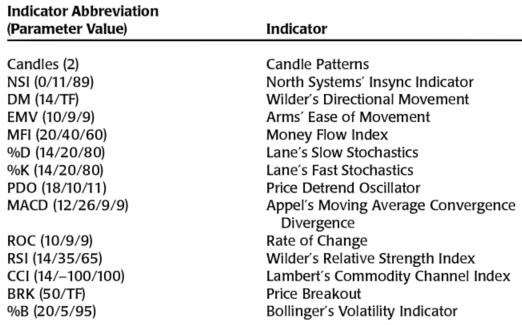 Table A
I'll do an article later on the North Systems' Insync Indicator. This was an indicator that Norm North and I created about a hundred years ago.
There are some important points to keep in mind when viewing these tables. All common stocks from all three stock exchanges (NYSE, Nasdaq, and Amex) were used in the analysis, 7275 issues in all, for a little over 13 years each, which resulted in over 14.6 million days of data and generated almost 1.7 million candle patterns.
IMPORTANT: Keep in mind that each individual stock is analyzed for its best performing indicator first, then the average of the totals of each best performing indicator and their respective performance when they were the best one is shown below. Similarly, the average of all Buy and Hold performance is shown when it was the best performer. The above paragraph is critically important to understand when viewing and analyzing these tables.
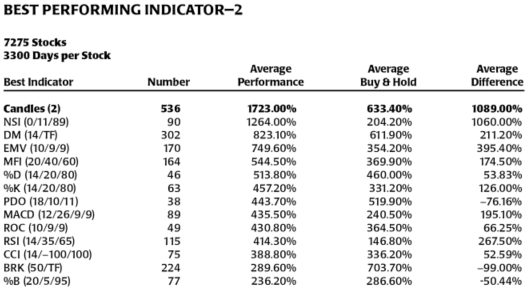 Table B
Table C shows the same ranking methodology but this time the candle pattern performance was measured after four days (Candles (4)). Here candle patterns performed on average over all the millions of data points, best out of the 14 technical indicators.
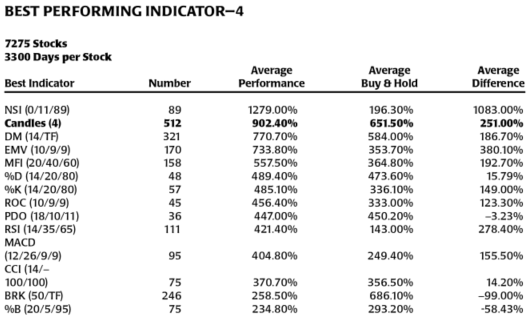 Table C
Table D shows the data after 5 days.
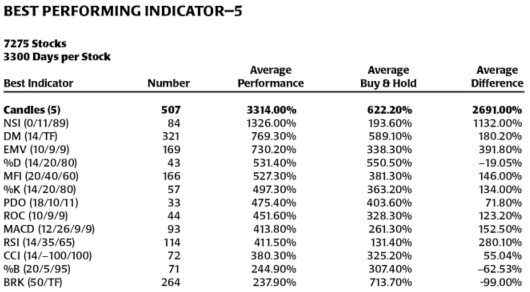 Table D
Conclusions on Candle Pattern Performance
First, the Candle Pattern Performance Summary.
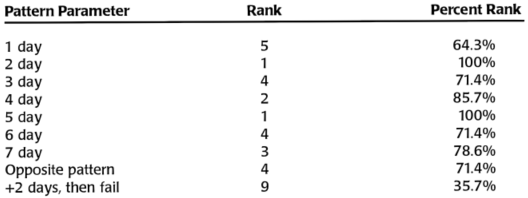 Table E
It should be obvious that candle patterns, as a whole, work better than many, if not most, price based technical indicators. Only one instance where they ranked less than the fifth best indicator out of the 14 indicators tested. That is a ranking of greater than 64%, over 92% of the time. The reason candle patterns react better on average is because they are generally shorter term than most technical indicators.
The next article will be the last one in the Candlestick Analysis series, called Putting It All Together. I’ll offer a process to use in validating and using candle patterns in your trading.
On April 27, 2016 I did an interview and slide presentation with the Market Technician’s Association – CLICK HERE.
Dance with the Trend,
Greg Morris