 Here we are at the end of the Candlestick Analysis series; hopefully a few of you are still with me. I’m going to show in this article the process I would use to incorporate candle patterns into my trading even though I am no longer a trader; not sure I ever was. Hey, there are enough non-traders out there offering trading advice, I just wanted to be honest about it. There are some things that must be met before I would consider a Japanese candle pattern to have any validity.
Trend
Of course, this is the most important component to candle pattern analysis; a pattern must be preceding by an appropriate trend. Reversal patterns are reversing something! They are reversing the trend that was used to help identify them in the first place. See Trend Determination article.
The Pattern
The candle pattern must meet my requirements for a valid pattern. See Pattern Identification article. Remember, the Japanese were very vague about all this two hundred years ago. One of the primary purposes of my book on candlesticks was to figure out the amount of flexibility to allow in the interpretation of a candle pattern.
Volume
This is only for common stocks. I don’t use volume much anymore but do believe it can assist in helping to validate a candle pattern. I like to look at volume that does three things:
1 – Volume on the last day of the pattern is greater than the 15-day average of volume.
2 – Volume increased on each day of the pattern.
3 – Volume on the last day of the pattern is greater than the volume on the other days of the pattern.
These can be used all together or in any combination. Individual stocks are about the only place I think volume still can play a part.
Support and Resistance
As you hopefully know by now, I ONLY consider horizontal or priced-based support and resistance lines (see article). I like to look at short term support and resistance levels over the latest 4-6 months. Chart A below shows an example. Any bullish candle patterns that fall on or very near a green support line will probably be a better one than if there is no support. Similarly, a bearish candle pattern on or very near a red resistance line has a good chance of improvement over one that isn’t near a resistance line.
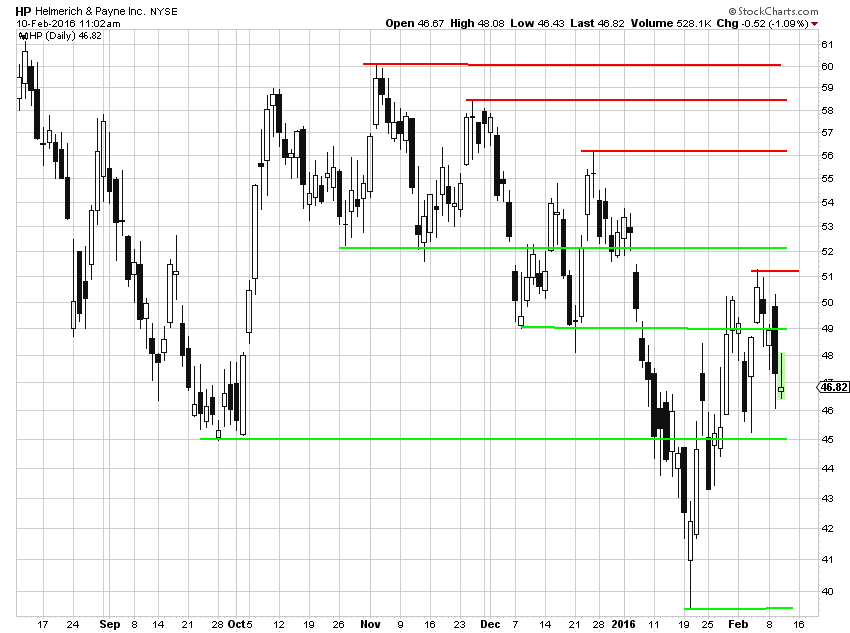 Chart A
Supporting Indicators
Directional Movement Index comes in a plus and minus version. If DI+ is above DI- then it supports bullish candle patterns and if below DI-, then it supports bearish patterns. I consider this an outside evidence of support. There can by any number of supporting indicators that identify times when candle patterns can be enhanced.
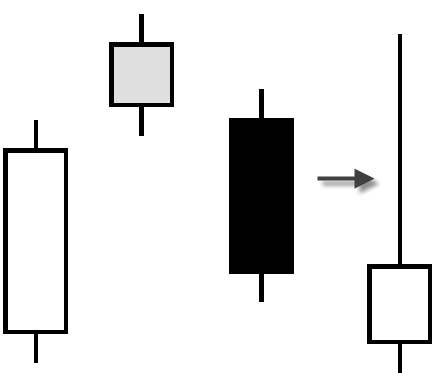
Pattern Breakdown
If you take a pattern and reduce it to a single candlestick, does the message of the single candlestick agree with the message of the entire pattern? The pattern below is a Dark Cloud Cover, a bearish reversal pattern. It breaks down into a Shooting Star which is also bearish. This adds validity to the pattern. Not all patterns breakdown into a complementary candlestick.
Filtering
I wrote an entire article on Filtering, please review it. I still like to use a 14 day %D and in addition a 9 day %D. Only trade on the 14 day, just use the 9-day as an early warning.
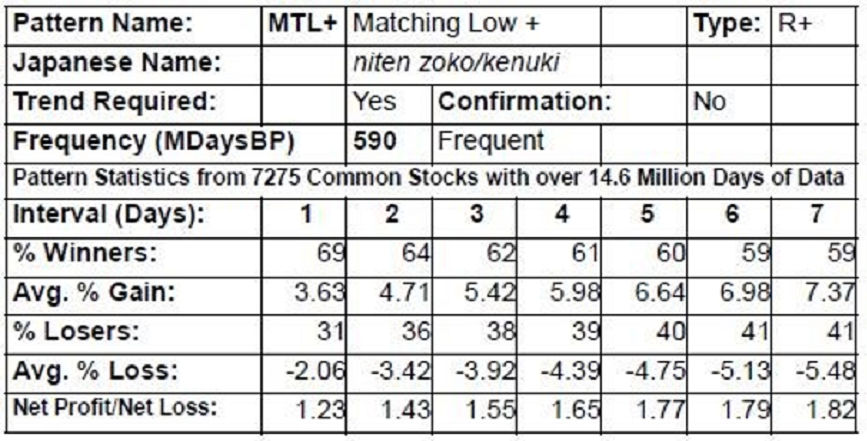
Statistics
These statistics were covered in an earlier article on candlesticks. A good pattern is one that has positive Net Profit/Loss per Trade across many time frames. Additionally, those with smaller Avg. Loss value are better.
 So there you have it – if I were an active trader this is how I would use Japanese candle patterns to assist in my trading. I am on the record for decades stating vehemently, that you should never us Japanese candle patterns in isolation – always use them with other technical tools. They can often offer an early indication to those price-based indicators.
I’m taking the next two weeks off to attend my 50th high school reunion in Kansas. I’m not staying for the actual Class of 2016 graduation as I fear they might arrange the seating for the Class of 1966 according to academic performance. Then off to Branson and eventually Dallas for kids and grandkids.
Dance with the Trend,
Greg Morris