DecisionPoint September 25, 2014 at 12:01 AM
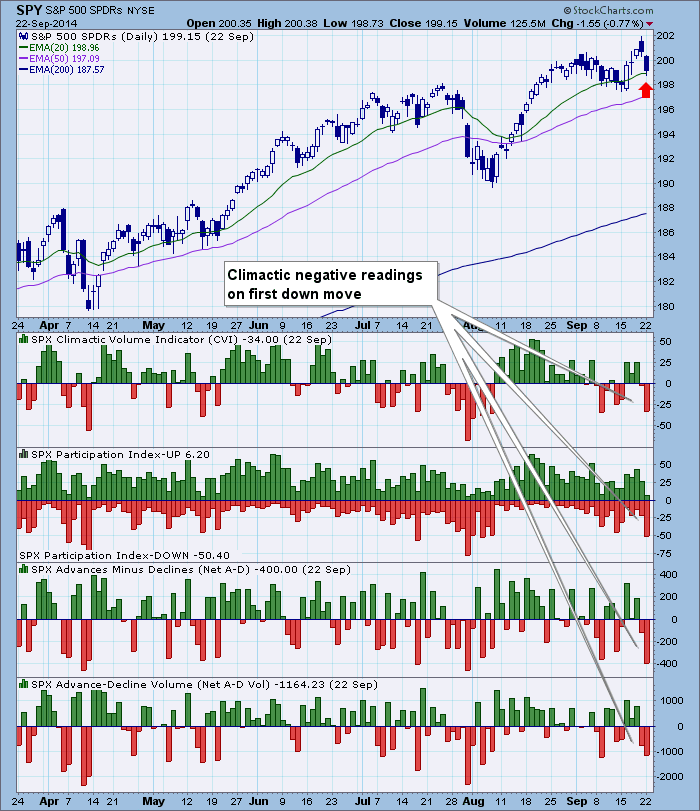
At ChartCon last month, I had quite a few questions from attendees regarding our ultra-short-term indicators and how you distinguish a positive or negative spike in readings as either a price initiation or exhaustion. We had a great example this week... Read More
DecisionPoint September 23, 2014 at 05:01 PM
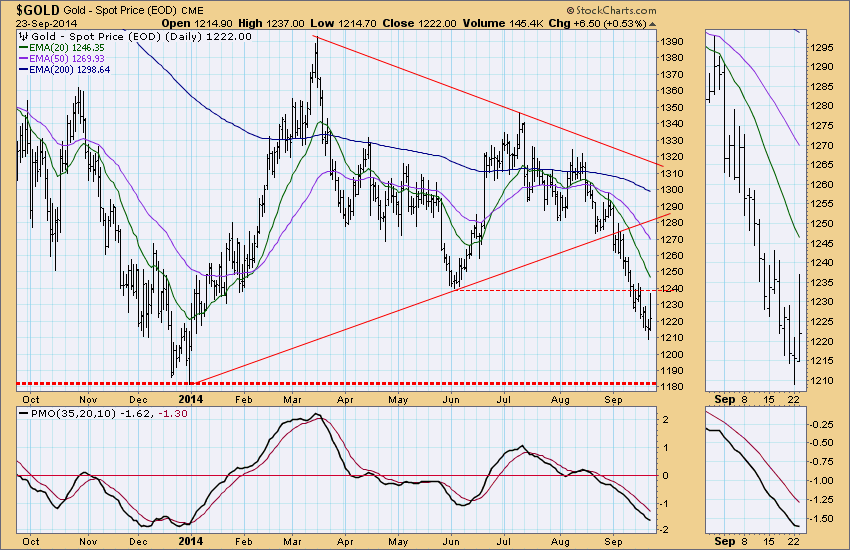
Gold has been performing badly for some time, but especially since August 21st when our Trend Model changed from a BUY to a SELL. The chart is completely negative with price below the 20EMA, which is below the 50EMA, which is below the 200EMA... Read More
DecisionPoint September 19, 2014 at 03:56 PM
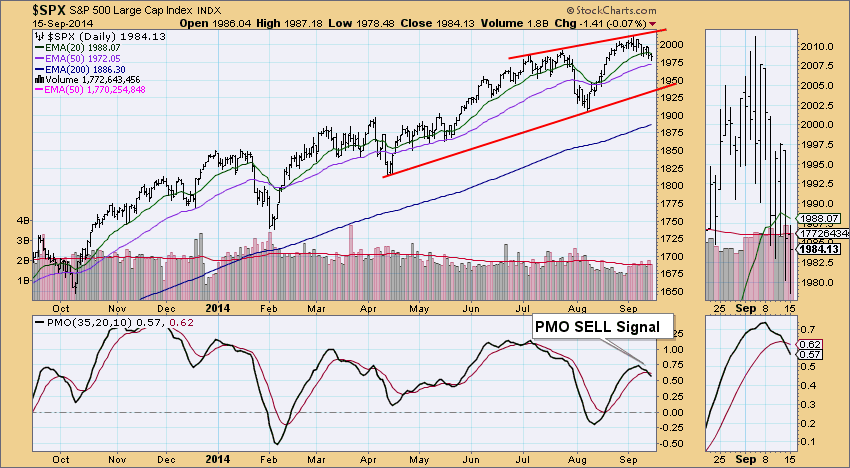
I recently received an email from a DP Daily Update subscriber: " On 9/16 [in the] DecisionPoint [blog] you wrote, "Indicators in all time frames are quite bearish." (First sentence of second to last paragraph... Read More
DecisionPoint September 16, 2014 at 01:46 AM
The free DecisionPoint Chart Gallery is a hidden gem with the link sitting in the middle of the StockCharts Homepage. You may want to review it daily (if you don't already!)... Read More
DecisionPoint September 12, 2014 at 03:16 PM
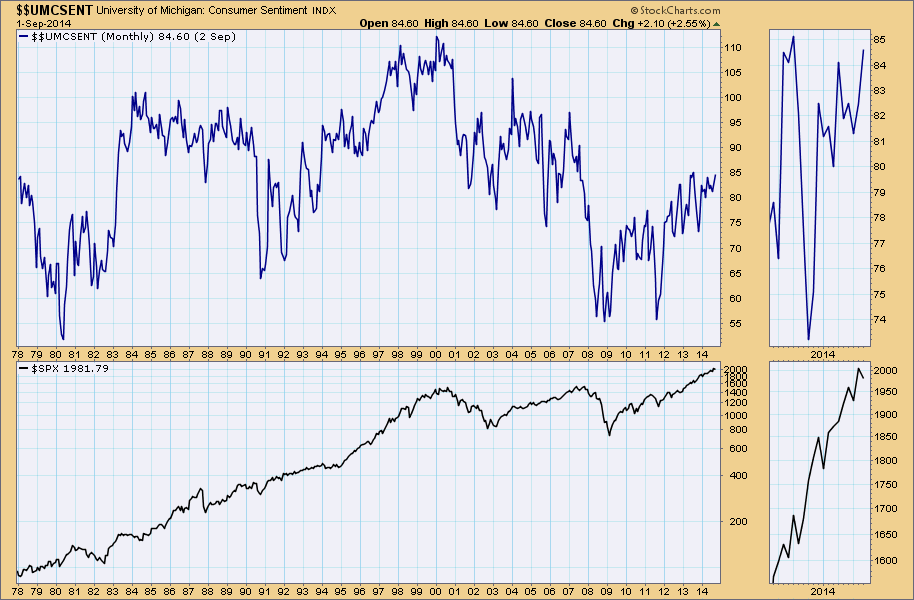
Just a quick note here to look at the University of Michigan Consumer Sentiment chart. It has been reported that Consumer Sentiment improved this month, and that it is near last year's high; however, in the historical context it is only midway its 35-year range... Read More
DecisionPoint September 10, 2014 at 06:20 PM
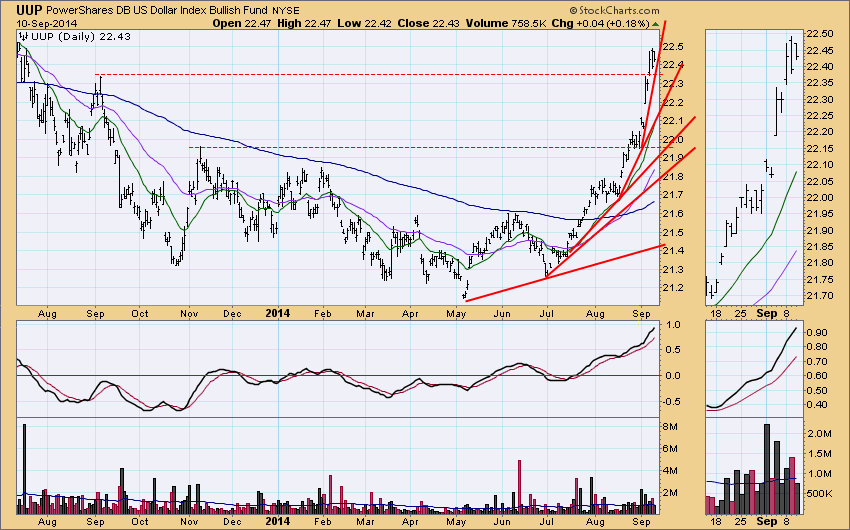
We all know that the dollar has been on a roll...but how much of a roll? Unfortunately, it is moving too high too quickly causing parabolic price rise visible on the charts for UUP... Read More
DecisionPoint September 09, 2014 at 06:43 PM
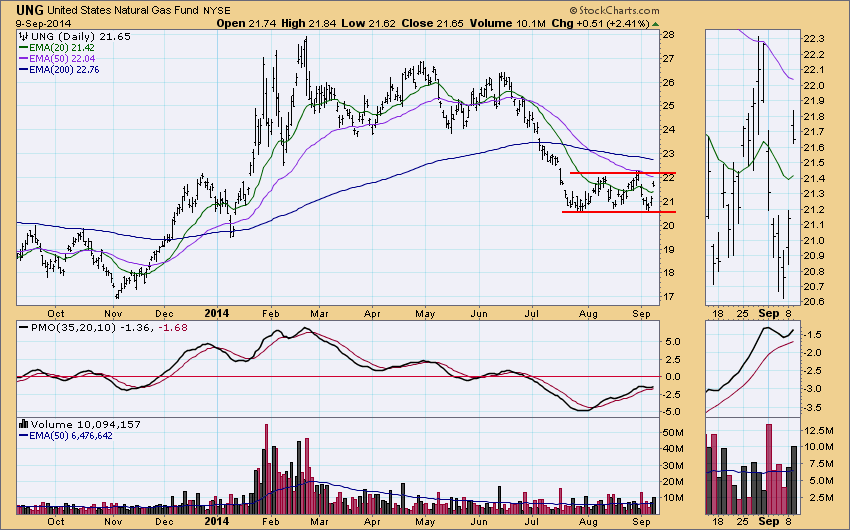
UNG, the Natural Gas ETF, caught our attention in today's ETF Tracker Report because it had the largest percentage up change at +2.41%. A quick check of the chart shows it being in a trading range for over a month, and today's move was not too impressive in that context... Read More
DecisionPoint September 03, 2014 at 07:05 PM
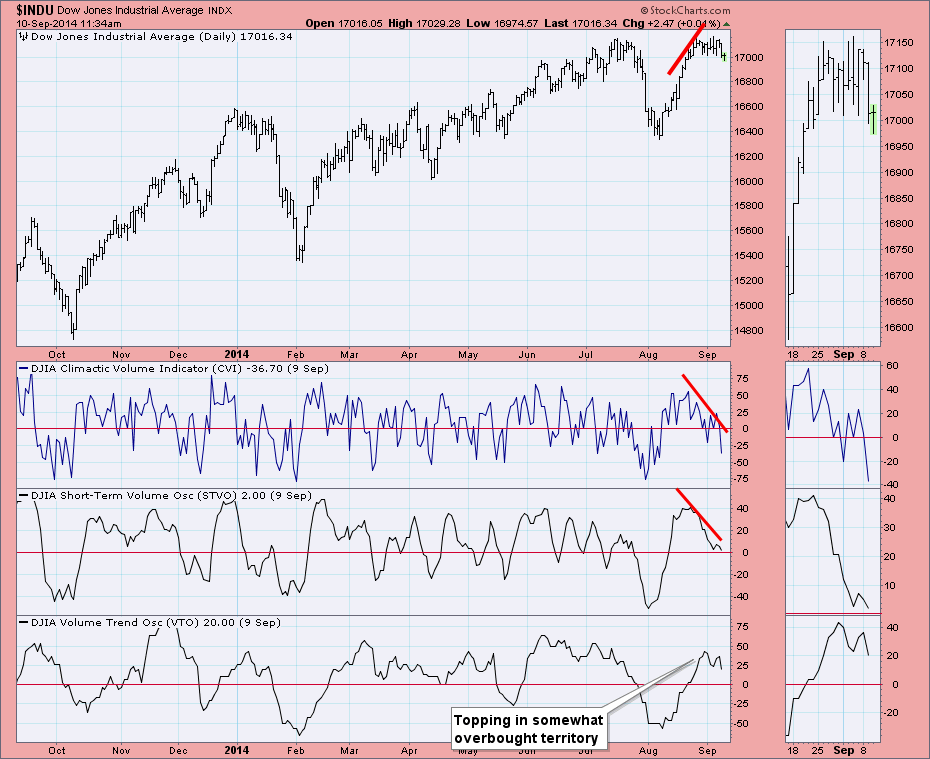
The DecisionPoint On Balance Volume (OBV) indicator suite that consists of three related indicators: Climactic Volume Indicator (CVI), Short-term Volume Oscillator (STVO), and Volume Trend Oscillator (VTO)... Read More