When in early-September SPY took out its August low, I thought that the fall correction was finally getting underway. But no. Instead, a slightly lower level of support was established, and price continued sideways. That support was tested successfully on Thursday, but Friday's attempt to extend the rally failed.
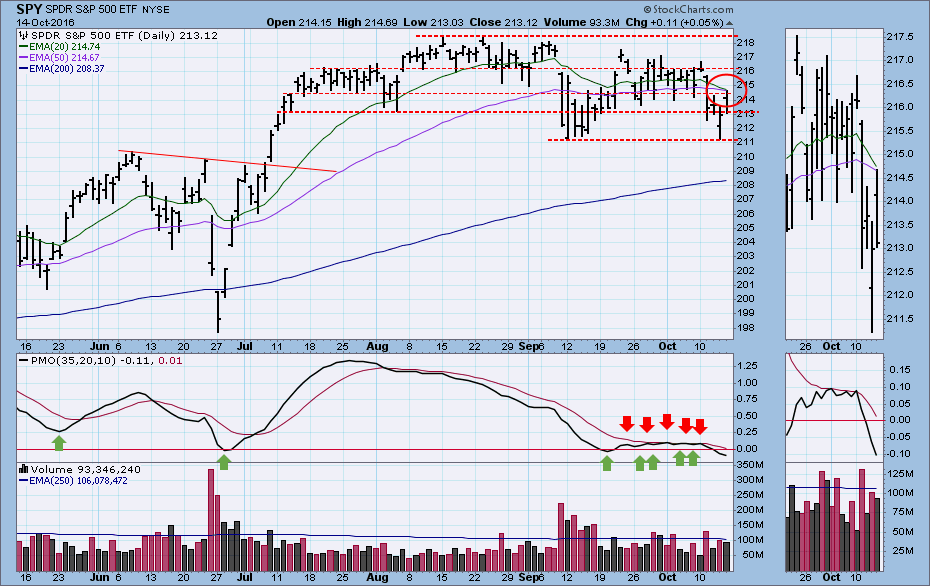
I have chosen to emphasize the various horizontal support/resistance levels that have materialized since July, but notice that price has failed to reach the top of the range for the last month, and a rounded top has formed. If the September low is taken out, a declining trend will be established.
An interesting feature on this chart is the behavior of the PMO over the last four weeks. The PMO bottom in the week of the 19th looked promising as a short-term BUY signal; however, the PMO quickly topped below the signal line, a very bearish sign. Well, neither the first PMO bottom or top proved prescient because four more tops and bottoms followed. You don't see this very often, and it emphasizes the indecision that dominates the market. Currently, the last PMO top rules, and the PMO has moved some distance down from the signal line. The pattern presents as flat, but it has a slightly negative bias.
Probably the most significant feature on this chart is that the 20EMA is about to cross down through the 50EMA, which would change the DecisionPoint IT Trend Model signal from BUY to NEUTRAL. The downside crossover could happen early next week as long as price remains below those two moving averages. (NEUTRAL means the model is neither long or short. It is in cash or fully hedged.)
CONCLUSION: The market has been moving sideways in a determined fashion, but the technicals show a slight but persistent deterioration. The PMO is falling below its signal and zero lines, and the IT Trend Model is about to change from BUY to NEUTRAL. A failed retest of Thursday's low would be quite negative.
The NEW DecisionPoint LIVE public ChartList has launched! Click on the link and you'll find webinar charts annotated just before the program. Additional "chart spotlights" will be included at the top of the list. Be sure and bookmark it!
Come check out the DecisionPoint Report with Erin Heim on Wednesdays and Fridays at 7:00p EST, a fast-paced 30-minute review of the current markets mid-week and week-end. The archives and registration links are on the Homepage under “Webinars”.
Technical Analysis is a windsock, not a crystal ball.
Happy Charting!
- Carl