From the August price top to the present, price has been deteriorating, and this week we finally got a bottom beneath the September bottom to officially set a declining trend. I think it is notable that the falling trend has persisted from the summer, when Clinton had a clear lead in the polls, to the present where Trump is reportedly closing the gap. One conclusion we could draw from that is that the market doesn't have a preference regarding the outcome of the election, that other issues are influencing market movement; however, we can't rule out some reaction once the election is decided. Let's look at the market condition so we can assess which reaction the technicals favor.
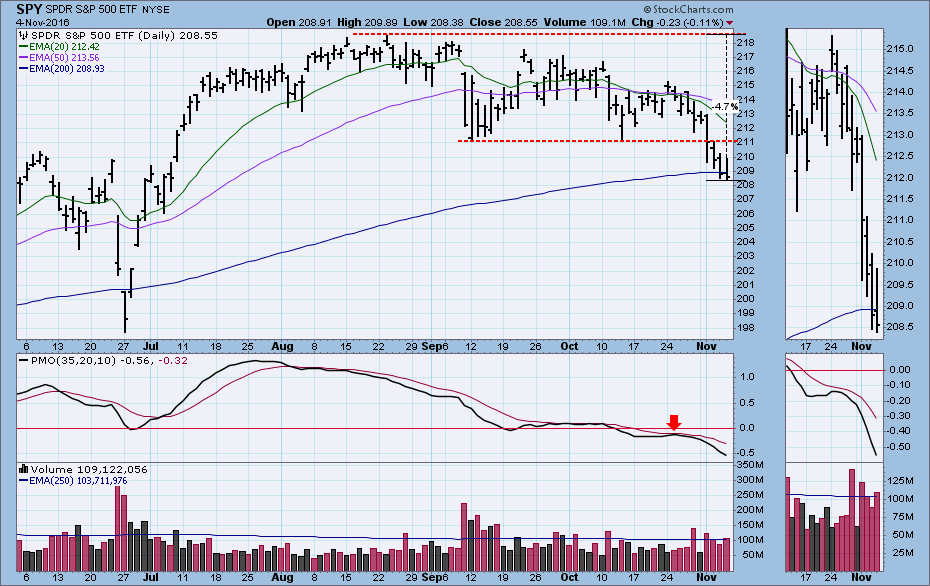
The SPY PMO is only slightly oversold, so there is plenty of room to accommodate further price decline. Notice that recent volume has picked up on down days, showing fading confidence in the bullish argument. Price is below the 200EMA, and the recent PMO top is below the signal line. The subsequent price decline is a textbook example of why we take that kind of PMO top as a danger sign.
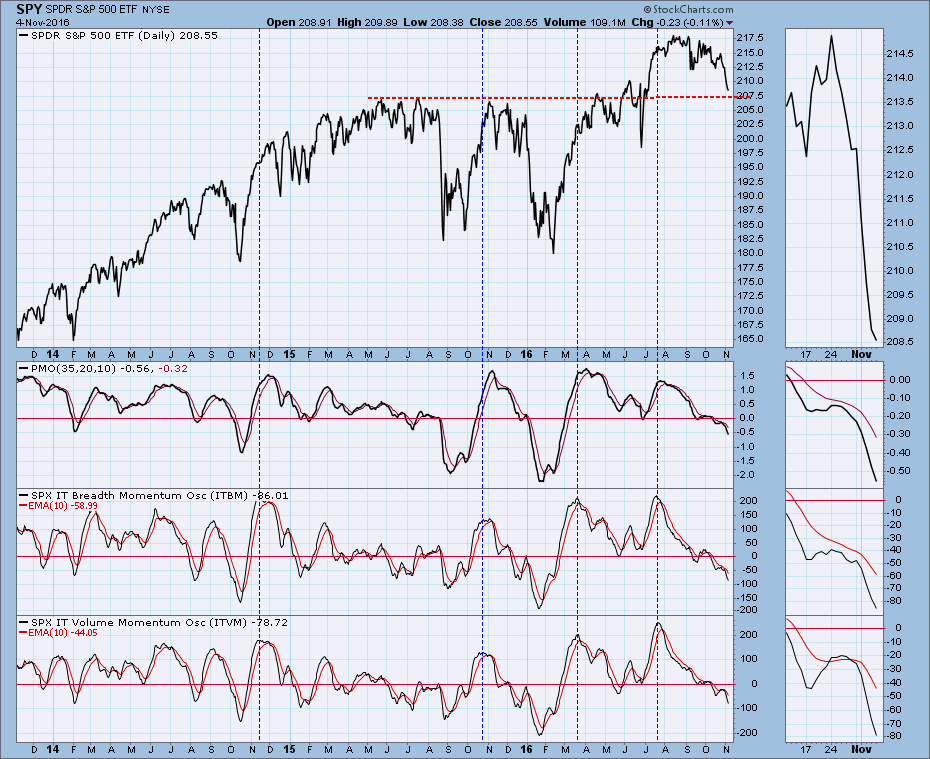
Below, our primary medium-term indicators for price, breadth, and volume are unified in the negative picture they present. They are all falling below the zero line, and they are a long way from the bottom of their normal range. A rally is not out of the question, but that is not the first thing that comes to mind when I look at this chart. The one positive element that stands out is that price is approaching an important level of support.
 CONCLUSION: The market condition makes me think that we are going to see continued negative price action, but the wild card is the election on Tuesday. If I actually knew which candidate was going to win, I don't think I would know what kind of reaction to expect.
The NEW DecisionPoint LIVE public ChartList has launched! Click on the link and you'll find webinar charts annotated just before the program. Additional "chart spotlights" will be included at the top of the list. Be sure and bookmark it!
Come check out the DecisionPoint Report with Erin Heim on Wednesdays and Fridays at 7:00p EST, a fast-paced 30-minute review of the current markets mid-week and week-end. The archives and registration links are on the Homepage under “Webinars”.
Technical Analysis is a windsock, not a crystal ball.
Happy Charting!
- Carl