 Technical analysis is a vast discipline that covers many different analysis processes. Through my continuing studies, I remembered reading about the "Presidential Election Cycle" and its effect on the markets. I thought this was a timely article given today is voting day. In this article I'll be referencing the figures from Perry Kaufman, Trading Systems and Methods.
Since 1983 based on S&P Futures, the pre-election year has 16.4% total returns and the actual election year is up 69.5%. The first year after the election, it is down 30% and the second year is up 48.3%. The simple rankings from best to worst: election year, second year, pre-election and first year. Typically the first year will be the worst as disillusioned voters find that campaign promises aren't fillable right away, if ever and new monetary or economic policies may be placed that are not popular.
There are few problems with these figures regarding the current election cycle. Here is a long-term chart that identifies in general what has been happening this election cycle. So ranking them, the election year is supposed to be the best of the four years. Based on just eyeballing the chart, we can see that in this election cycle, election year only ranked 3rd. Interestingly, the first year of this cycle was the best and it is supposed to be historically the worst. This is probably due to the Fed which has become integral in fanning the flames of the market with buybacks and zero interest rates.
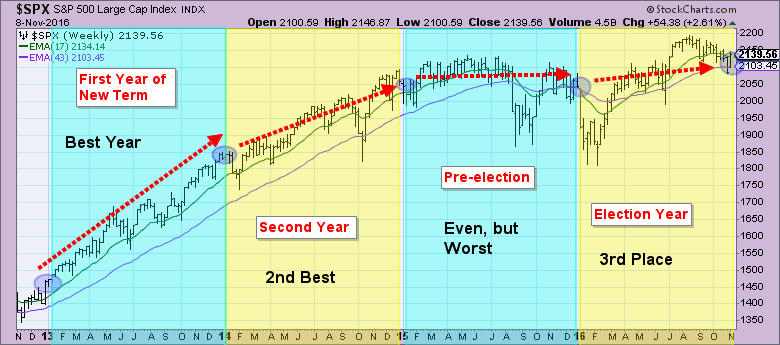
If we take into account historical returns from 1912 to 1992, the rankings change somewhat. Pre-election is the best at 11%, election year is 7%, first year is 4.7% and the second year is 2.3%. This cycle still doesn't fit our current cycle.
Conclusion: We all know that this election cycle has been like no other and the charts seem to agree. The most concerning information to be gained would be that the first year typically is the worst and election year the best. Regardless of who wins, the market seems to be preparing for a corrective move as prices have stagnated and appear to be rolling over. Cycle analysis being what it is, a finesse subject, there is plenty of room for shift, error, etc. but this study is interesting nonetheless.
The NEW DecisionPoint LIVE public ChartList has launched! Click on the link and you'll find webinar charts annotated just before the program. Additional "chart spotlights" will be included at the top of the list. Be sure and bookmark it!
Come check out the DecisionPoint Report with Erin Heim on Wednesdays and Fridays at 7:00p EST, a fast-paced 30-minute review of the current markets mid-week and week-end. The archives and registration links are on the Homepage under “Webinars”.
Technical Analysis is a windsock, not a crystal ball.
Happy Charting!
- Erin