Carl Swenlin wrote back in a July 2014 an in-depth article about the Rydex Cashflow and Asset Ratios. His explanation of sentiment in relation to the Rydex Ratios is simple and well-stated so I won't rewrite it:
"Sentiment has traditionally been measured by taking polls of selected groups of investors, advisors, investing professionals, etc. There have been and still are problems associated with this methodology: (1) The polls are normally taken over a period of several days, during which time market movement and investor outlook can change radically; (2) The responses are strictly subjective, reflecting the emotional status of the person being polled, not necessarily his/her investment position. The Rydex Ratio makes it possible for us to analyze sentiment based upon what investors are actually doing with real money."
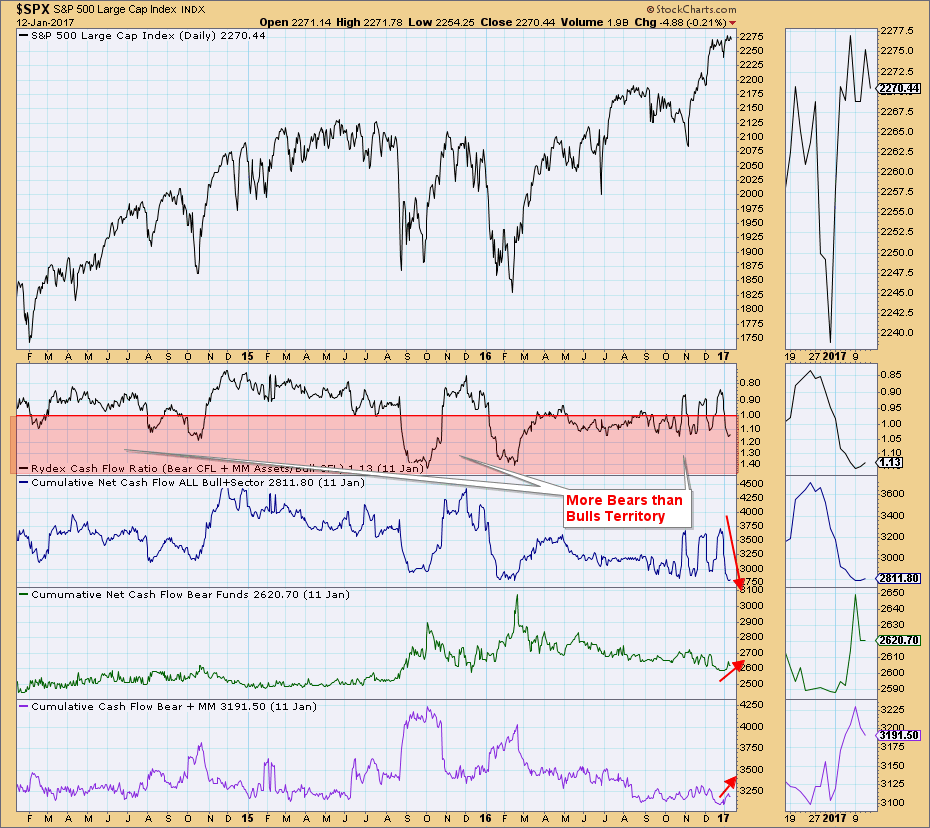
The Rydex Cashflow Ratio is based on cumulative cash flow into and out of bear and bull funds as well as money market funds. The ratio is:
(Bear Funds CCFL + Money Market Fund) / (Bull Funds CCFL + Sector Funds CCFL)
When analyzing sentiment, remember that it is a contrarian indicator. At market tops, everyone is bullish and at market bottoms, everyone is bearish. Basically, once everyone gets on the band wagon, the wheels fall off.
Currently, cashflow into bear funds is higher given the ratio is greater than one. More importantly, money has been flowing quickly out of bull funds to reach an annual low. Additionally, bear funds and money markets cashflow is growing, albeit not by much, but it is increasing nonetheless. It appears that investors are getting more and more bearish. Since sentiment is contrarian, this chart is actually telling us that we may be nearing a market bottom, not a top.
However, a quick caveat: while we use the Ratios to infer broad market sentiment, we must remember that Rydex assets represent only a small fraction of assets in the total stock market.
 Conclusion: The Rydex Cashflow Ratio (and its sister the Rydex Assets Ratio) are excellent tools for measuring sentiment as they show you where investors are actually putting their money. Sentiment polls are based on emotion and don't always reflect how the investor is actually managing their investments.
The NEW DecisionPoint LIVE public ChartList has launched! Click on the link and you'll find webinar charts annotated just before the program. Additional "chart spotlights" will be included at the top of the list. Be sure and bookmark it!
Come check out the DecisionPoint Report with Erin Heim on Wednesdays and Fridays at 7:00p EST, a fast-paced 30-minute review of the current markets mid-week and week-end. The archives and registration links are on the Homepage under “Webinars”.
Technical Analysis is a windsock, not a crystal ball.
Happy Charting!
- Erin