 The DecisionPoint LIVE webinars on Wednesday and Fridays at 7:00pm EST are news programs. In just 30 minutes, I go over the current DecisionPoint Scoreboards, cover daily/weekly/monthly charts of major large- and small-cap indexes, review indicators and finish with analysis of the "Big Four" -- Dollar, Gold, Oil and Bonds. I've found through communicating with my viewers and readers that they wanted hands-on advice or instruction on how to analyze a chart using the DecisionPoint Analysis Process. I've begun taking symbol requests so I can do a "Chart Spotlight" at the end of the program to give viewers just that...a real-time review of a symbol.
As part of the learning process, I thought today, I would give you a few general steps to analyze a chart the DecisionPoint way.
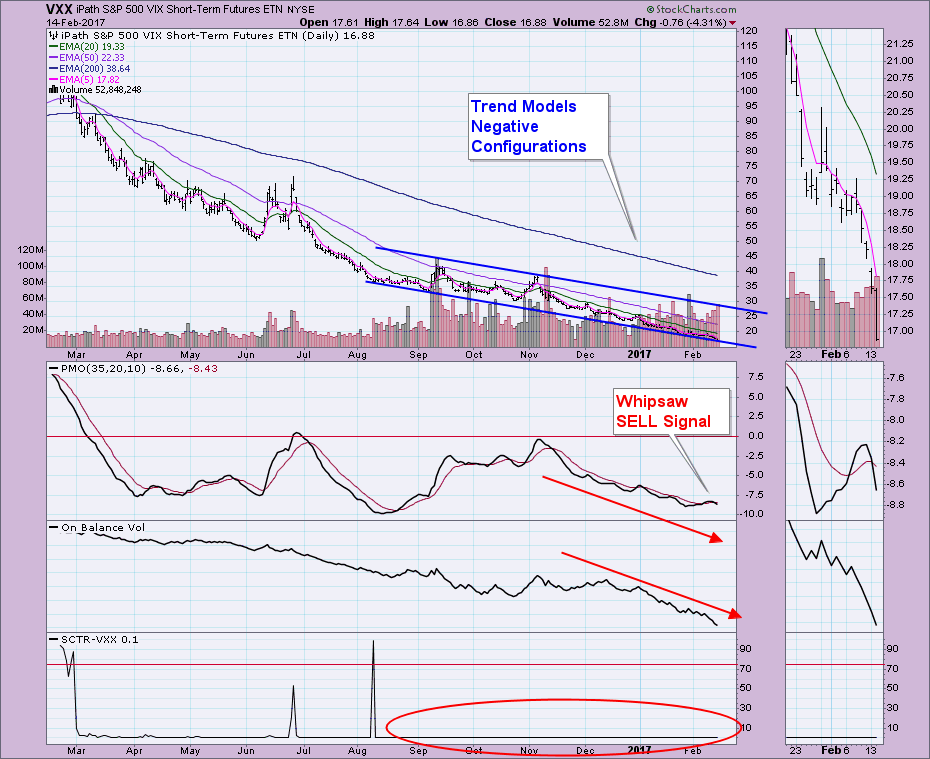
I was recently asked to review VXX below as a possible BUY on Friday. Here are the basic steps I go through (not necessarily in this order):
1. Trend Model Signals - These signals are determined by the location of the 5/20/50/200-EMAs. At this time, the IT Trend Model is on a Neutral signal (the 20-EMA crossed below the 50-EMA while the 50-EMA was above the 200-EMA). The ST and LT Trend Models are on SELL signals (5-EMA below 20-EMA while 20-EMA is below the 50-EMA and the 50-EMA is below the 200-EMA). Not a good start.
2. Price Momentum Oscillator (PMO) Configuration - VXX just generated a PMO SELL signal. When my viewer asked me about this symbol, the PMO was still on a BUY signal in oversold territory. Okay, let's say it was still on a BUY signal. The Trend Models are on bearish signals.
3. Price pattern and its relationship to PMO/OBV/SCTR - The price pattern is bearish, the OBV is confirming the decline and the SCTR has been without a heartbeat for months.
4. Review the weekly (and possibly the monthly) chart. VXX has been in decline and in what could be considered a basing pattern on the weekly chart. A breakout from this pattern could mean it's ready to begin a new rising trend. But, it hasn't. The PMO is oversold, but it doesn't look at all interested in slowing its descent.
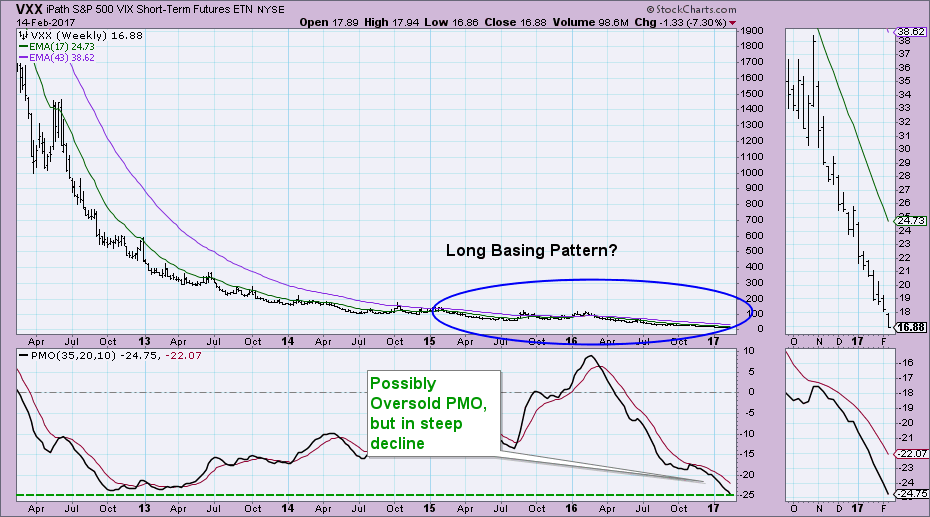 Conclusion for VXX? I wouldn't get near it even with what appeared to be a new PMO BUY signal Friday. Don't compromise or get impatient. One bright spot (PMO BUY signal on Friday) doesn't counteract all of the negative and for VXX it's very negative.
Alright, let's look at one more symbol and follow the steps above. Goldman Sachs Group (GS) looks very interesting.
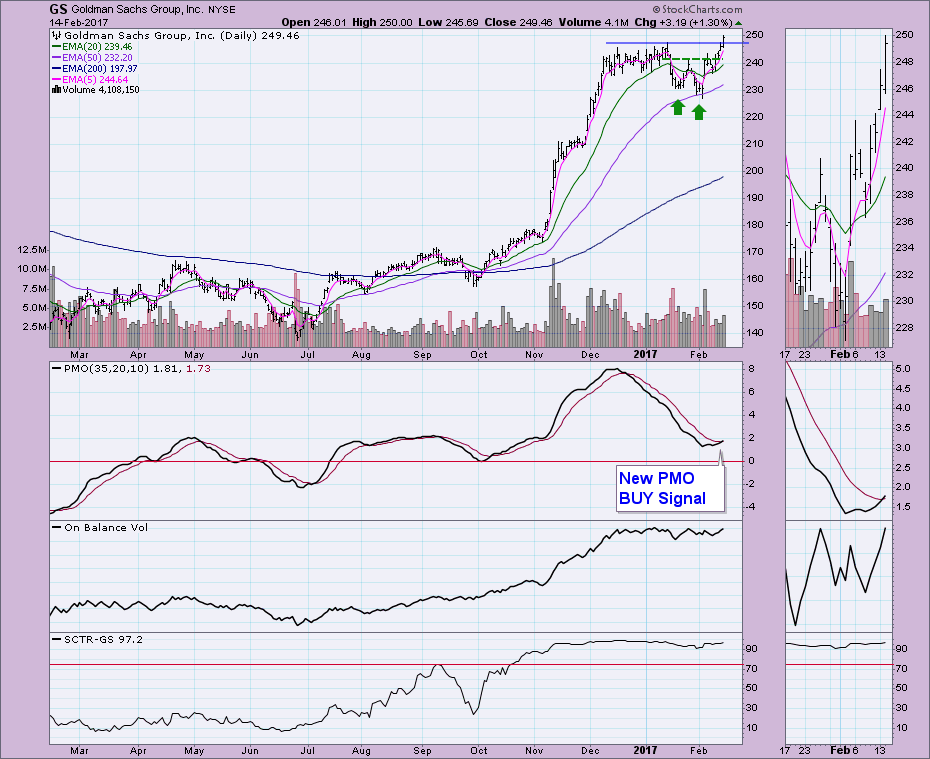
1. Trend Models - All on BUY signals. 5-EMA > 20-EMA > 50-EMA > 200-EMA
2. PMO - New BUY signal in near-term oversold territory. (Meaning that although not at the bottom of its normal range, the PMO has turned up at this level before and it was followed by rallies).
3. Price Pattern and relationship to indicators. I see a bullish double-bottom that executed last week that suggests a price target around $252 (add the length of the pattern to the neckline). Additionally, we have a nice breakout to new all-time highs. The OBV isn't telling us much right now as it is fairly flat. The SCTR is healthy.
4. Weekly chart review. There could be longer-term issues with GS. Price is at an all-time high which could put some downward pressure on price. The PMO is very overbought on the weekly chart and has begun to decelerate.
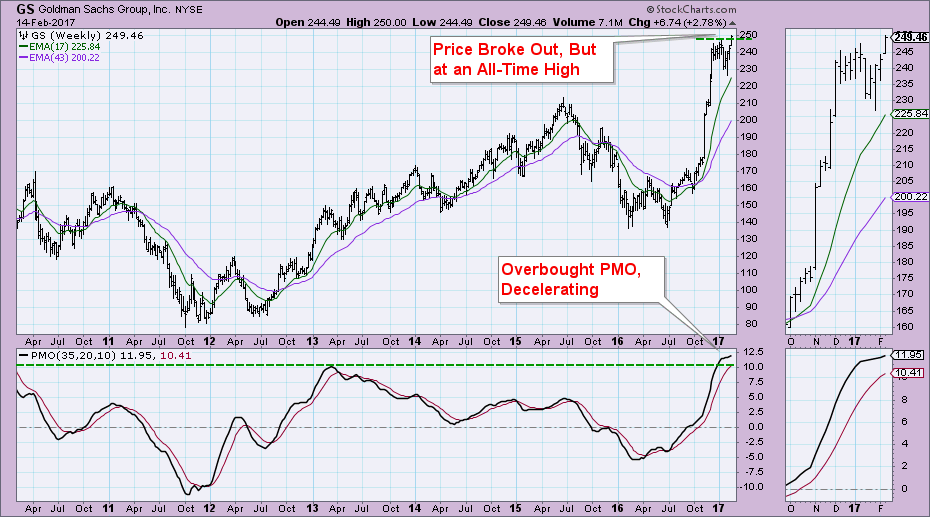 Conclusion for GS? Looks pretty good in the short term, but there are some problems with the weekly chart; maybe this is a better short-term investment with a tight stop.
Conclusion: I hope this has given you some quick insight on how to quickly analyze a chart the "DecisionPoint" way. Chart Spotlights are for teaching purposes only and should not be considered a recommendation to buy or sell any trading vehicle. Tune in to my webinars to see more Chart Spotlights or you can watch the recording in the StockCharts.com Webinar Archive.
The NEW DecisionPoint LIVE public ChartList has launched! Click on the link and you'll find webinar charts annotated just before the program. Additional "chart spotlights" will be included at the top of the list. Be sure and bookmark it!
Come check out the DecisionPoint Report with Erin Heim on Wednesdays and Fridays at 7:00p EST, a fast-paced 30-minute review of the current markets mid-week and week-end. The archives and registration links are on the Homepage under “Webinars”.
Technical Analysis is a windsock, not a crystal ball.
Happy Charting!
- Erin