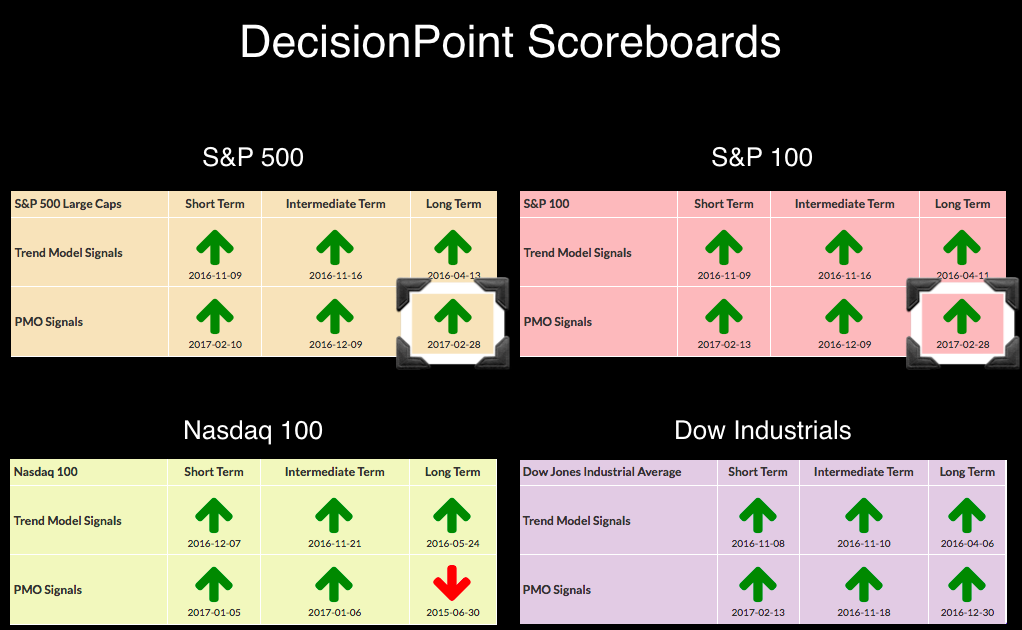
The DecisionPoint Scoreboards in the DP Chart Galleries are now almost completely bullish. Two new Long-Term Price Momentum Oscillator (PMO) BUY signals appeared for the S&P 500 and S&P 100 when the monthly charts went final today. We don't tally up our Long-Term PMO signals until the end of the month when the chart goes "final". Both the SPX and OEX sported these Long-Term PMO BUY signals since mid-month but we don't log them until the last day of the month.
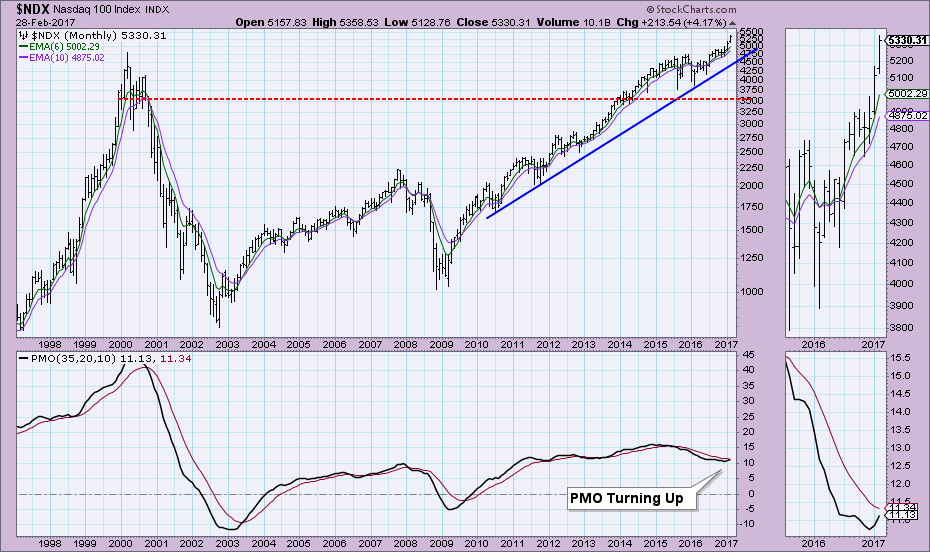
What may seem surprising is that the Nasdaq 100 was unable to post the same Long-Term PMO BUY signal. However, if you look at its monthly chart you can see why. If you recall, when the Dow Industrials took off late last year, the NDX was the laggard. It struggled until the end of last year, consolidating mostly sideways. By the time it had turned around, it had a greater distance to travel to generate a BUY signal.
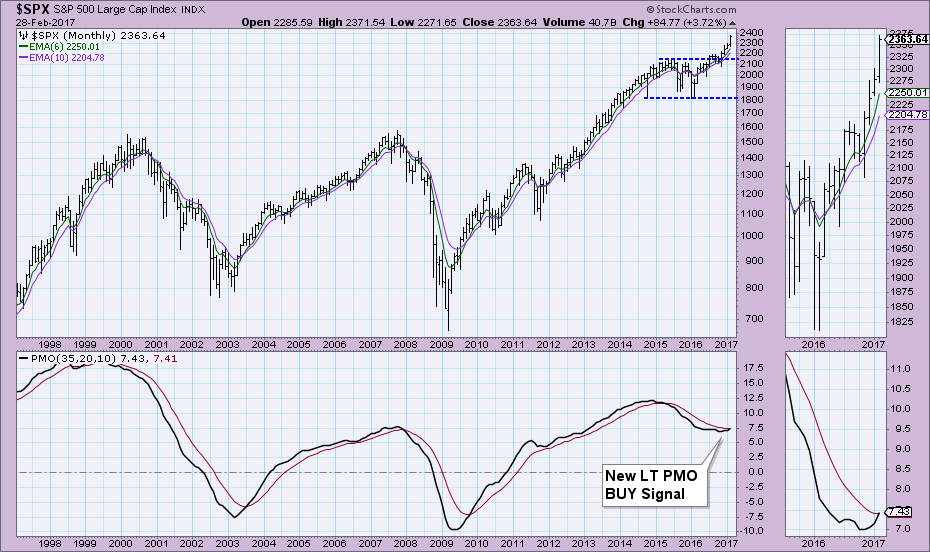
 The SPX also dropped fairly far from its signal line, but the rally recovery was nearly straight up, enabling the PMO to trigger this latest PMO BUY signal.
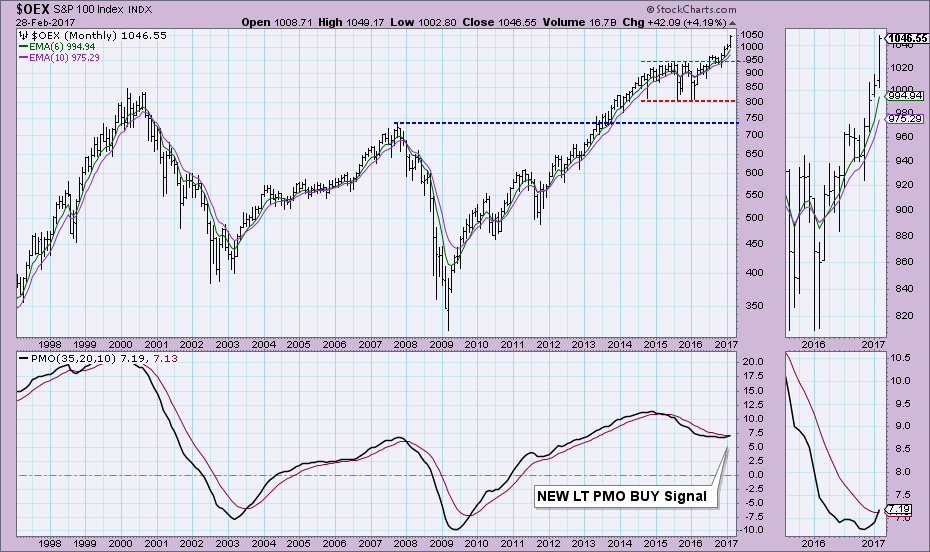
The S&P 100 triggered a LT PMO BUY signal as well. It spent 2016 rallying out of the January low. The PMO crossover BUY signal does arrive in near-term overbought territory (note the peak from 2007). The PMO should be clearing those conditions, but it was not possible given the strength of the rally.
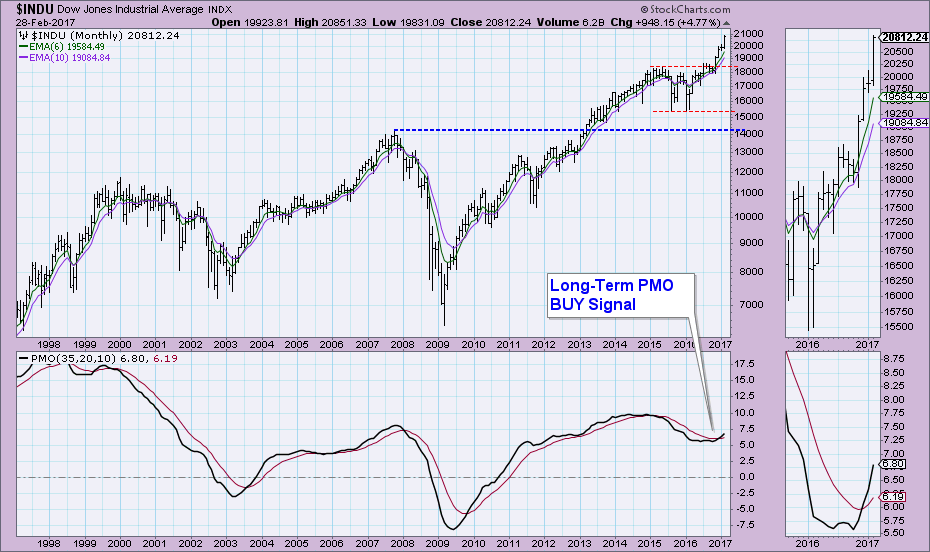
The Dow has experienced the most powerful rally of the DP Scoreboard Four which enabled it to trigger the PMO BUY signal last month.
Conclusion: There is a clear bullish bias in the long term. It is visible on the DP Scoreboards available to review in the DP Chart Gallery. There are now two new LT PMO BUY signals. A review of the DP LIVE shared ChartList will show you that the 50-EMAs are securely locked well above the 200-EMAs. When the 50-EMA is above the 200-EMA DecisionPoint analysis considers that stock, index, ETF, etc. to be in a "bull market". Add the weekly PMO BUY signals and both the intermediate term and long term are bullish.
The NEW DecisionPoint LIVE public ChartList has launched! Click on the link and you'll find webinar charts annotated just before the program. Additional "chart spotlights" will be included at the top of the list. Be sure and bookmark it!
Come check out the DecisionPoint Report with Erin Heim on Wednesdays and Fridays at 7:00p EST, a fast-paced 30-minute review of the current markets mid-week and week-end. The archives and registration links are on the Homepage under “Webinars”.
Technical Analysis is a windsock, not a crystal ball.
Happy Charting!
- Erin