*** IMPORTANT NOTE: We are making some changes to our DecisionPoint blogs and webinars starting on April 1st.Click here for more details. ***
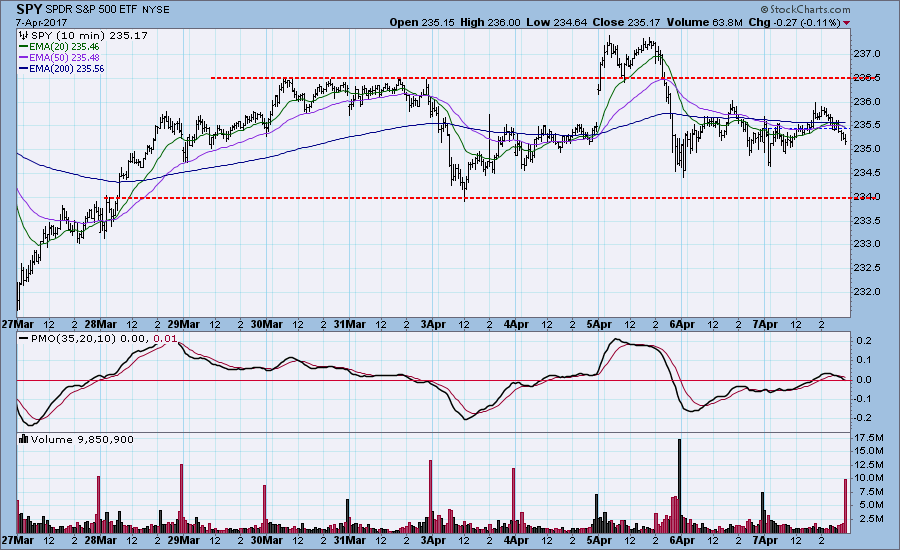
Despite a negative reaction to Fed comments, and the U.S attack on a Syrian air base, the market held steady within the current corrective phase. The 10-minute bar chart below shows two weeks of activity. Note that the bottom of a decline on Monday defined the bottom of a trading range that would hold for the rest of the week. An attempt to break out of the range on Wednesday failed, and prices retreated back into the sideways pattern initiated after Monday's bottom.
The DecisionPoint Weekly Wrap presents an end-of-week assessment of the trend and condition of the stock market (S&P 500), the U.S. Dollar, Gold, Crude Oil, and Bonds.
STOCKS: Based upon a 11/15/2016 Intermediate-Term Trend Model BUY signal, our current intermediate-term market posture for the S&P 500 (SPY) is bullish. The Long-Term Trend Model, which informs our long-term outlook, is on a BUY signal as of 4/1/2016 so our long-term posture is bullish.
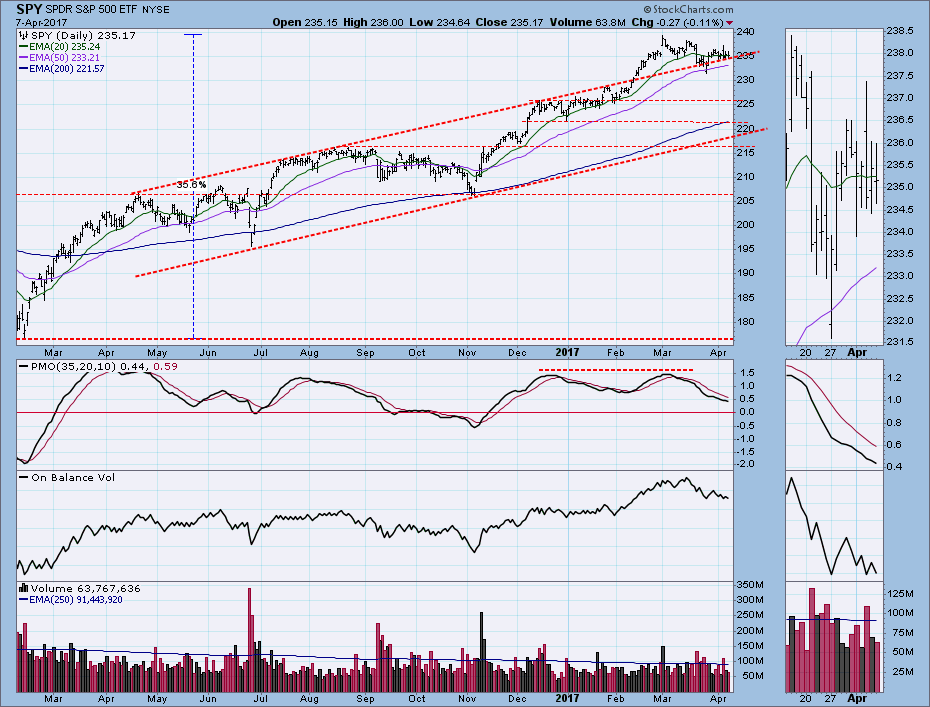
The one-year daily chart shows how prices broke out of a rising trend channel in February, then moved sideways and slightly down through Friday's close. If a more serious decline begins, I have drawn several lines of potential support. For now it appears that the market is working off the excess of the last advance by churning sideways. The PMO (Price Momentum Oscillator) has declined from its March top, reflecting internal correction. While I like to see much lower PMO readings as a base for new price advances, in a bull market a PMO bottom at this level would be sufficient.
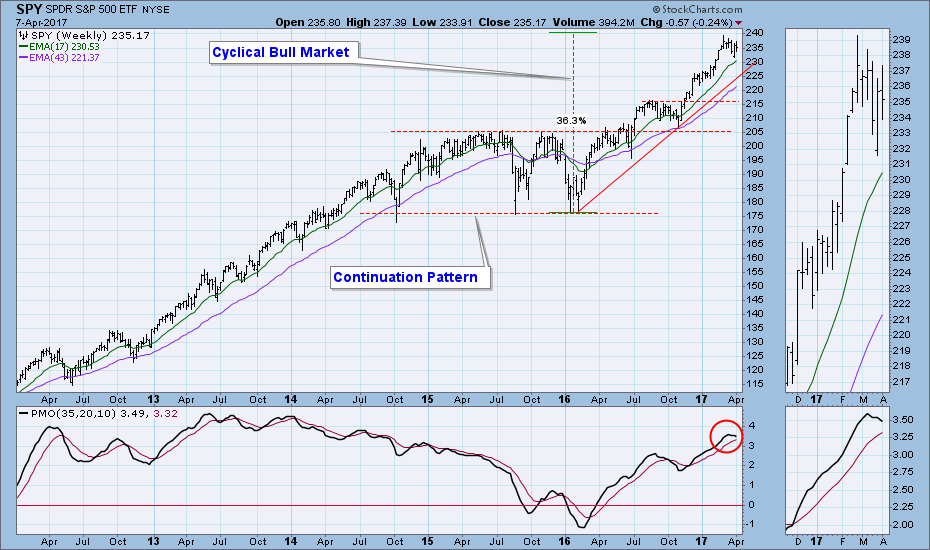
The weekly chart below shows the cyclical bull market rising from the 2016 low. The weekly PMO has topped, and the rising trend line suggests a potential decline back to about the mid-220s.
Short-Term Indicators: Slightly oversold in this time frame. Otherwise, not very informative.
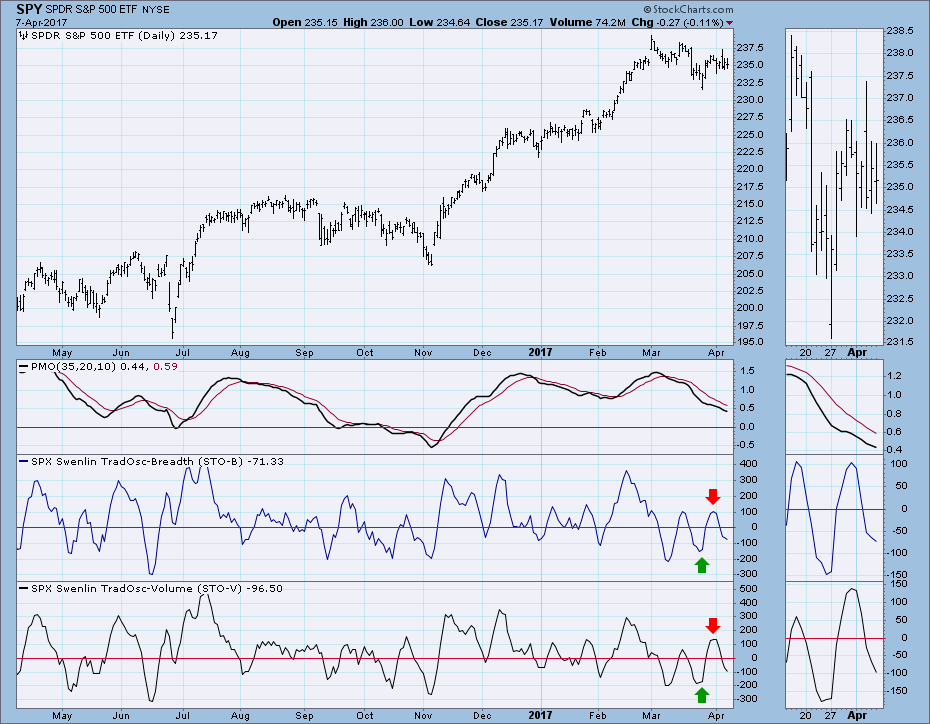
Intermediate-Term Indicators: The PMO is still unwinding. Breadth (ITBM) and volume (ITVM) are oversold for a bull market, and they are chopping around trying to bottom.
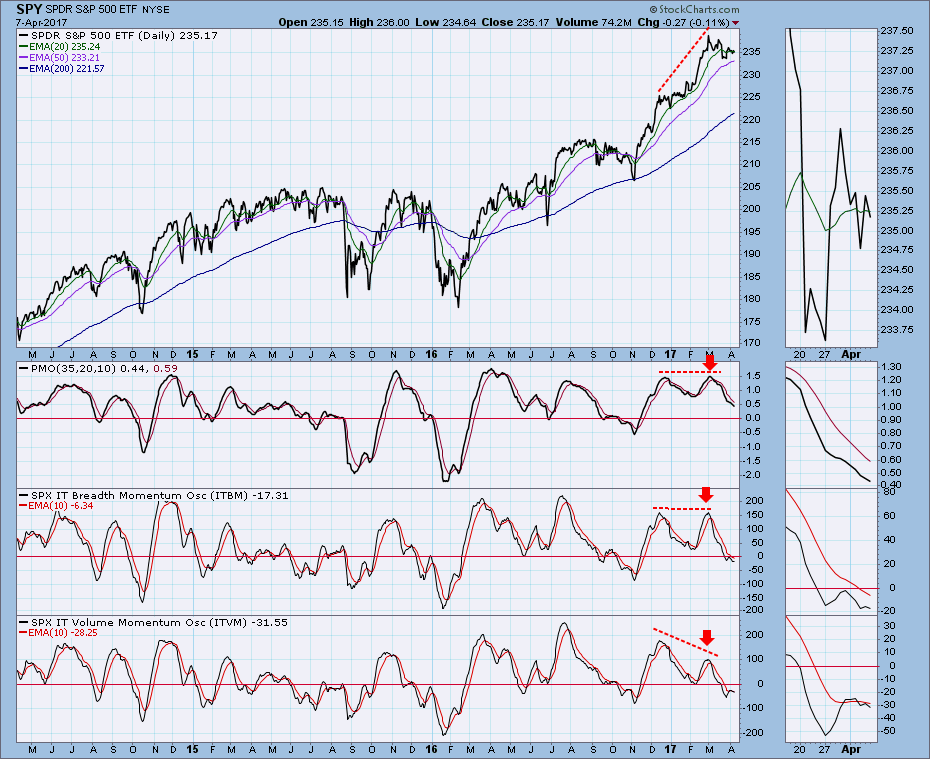
Conclusion: We are in a cyclical bull market (since February 2016) within a secular bull market (since early-2009), and neither show signs of abating. I expect the market to continue correcting the excesses from the advance off the October lows, but I wouldn't bet against the bull. When will the correction end? For me, the first sign that a new up leg was beginning would be when the daily PMO turns up. That is a very short-term and somewhat fragile signal, but it will definitely get my attention.
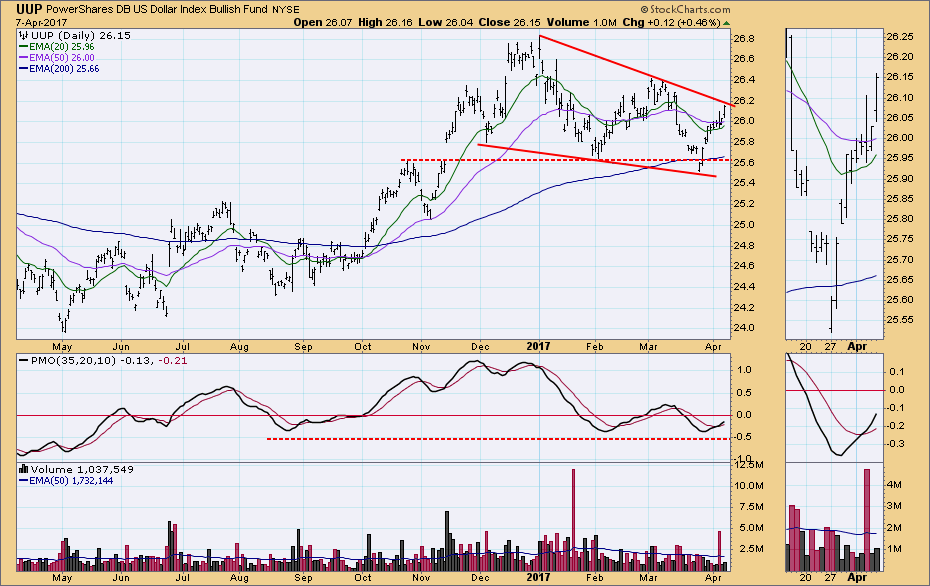
DOLLAR: As of 3/21/2017 the US Dollar Index ETF (UUP) is on an Intermediate-Term Trend Model Neutral signal. The Long-Term Trend Model, which informs our long-term outlook, is on a BUY signal as of 10/17/2016, so our long-term posture is bullish.
The dollar was not deterred by world events, and it remained in rally mode through the week. The falling wedge on the daily chart below is most likely to resolve to the upside, and the PMO positive divergence supports that projection.
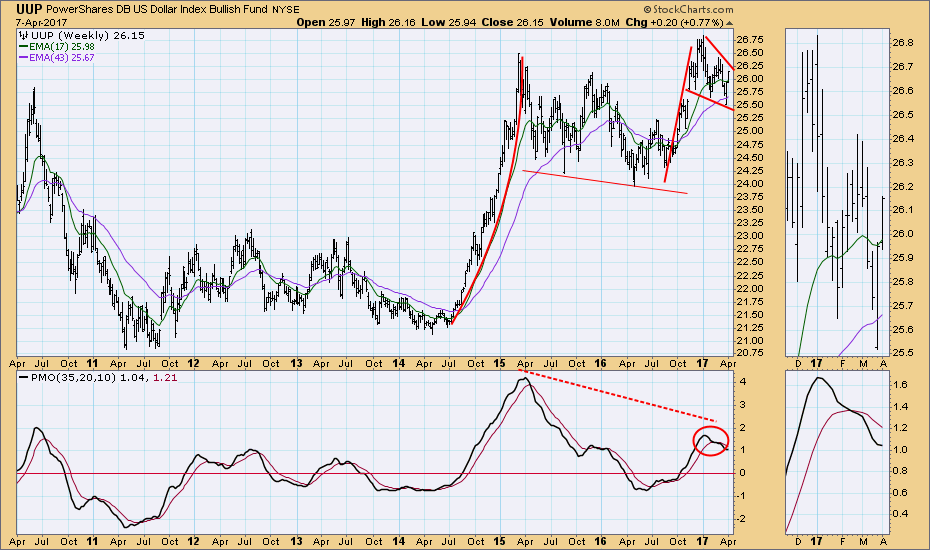
The weekly UUP chart shows a bullish flag formation, and, while the weekly PMO is falling, it is close to forming a bottom.
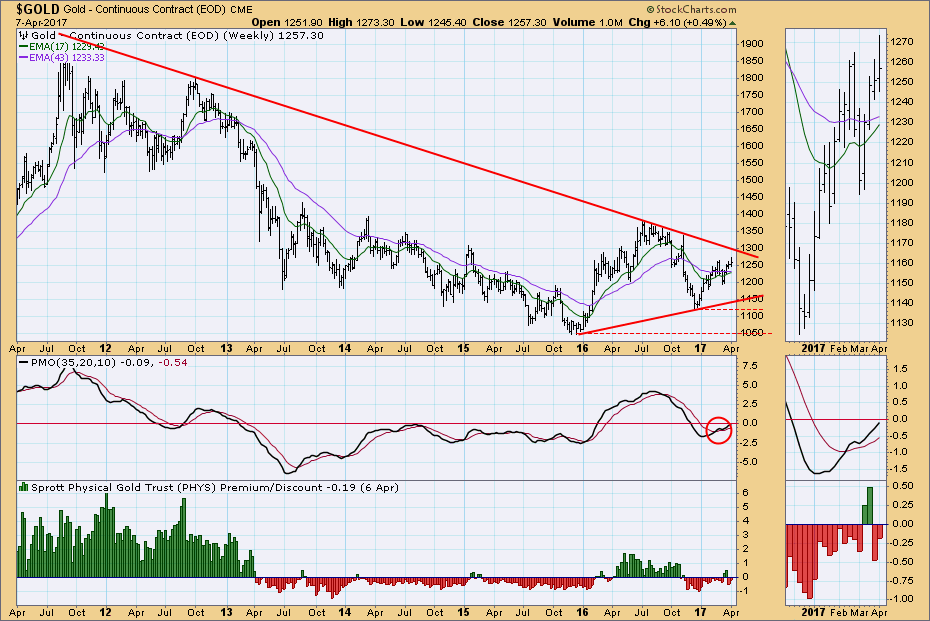
GOLD: As of 2/3/2016 Gold is on an Intermediate-Term Trend Model BUY signal. The Long-Term Trend Model, which informs our long-term outlook, is on a SELL signal as of 11/25/2016, so our long-term posture is bearish.
An early bullish reaction to the U.S attack on the Syrian air base Friday faded as the day wore on, and I think we can say that the three-week topping process has not ended and is still in progress.
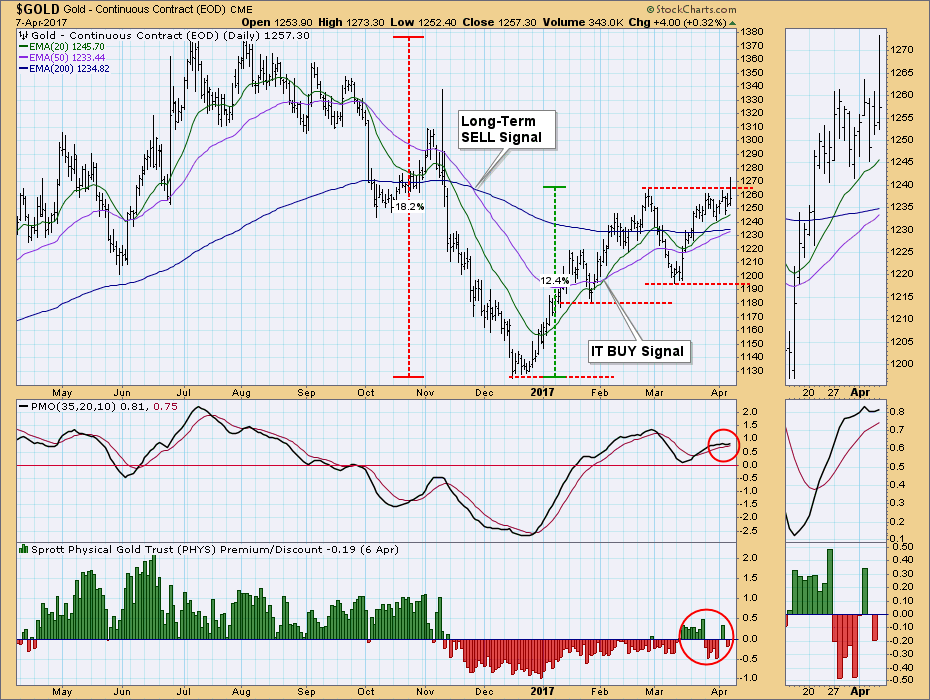
With the weekly PMO still rising above its signal line, the long-term picture is bullish, but the triangle pattern of price is still unresolved.
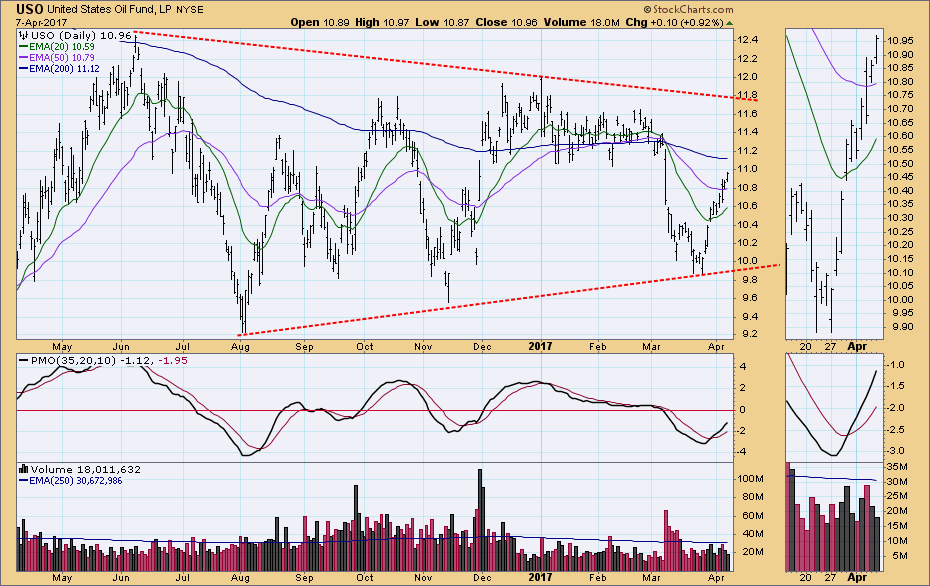
CRUDE OIL (USO): As of 3/8/2017 United States Oil Fund (USO) is on an Intermediate-Term Trend Model Neutral signal. The Long-Term Trend Model, which informs our long-term outlook, is on a SELL signal as of 3/9/2017, so our long-term posture is bearish.
The one-year daily chart shows USO moving sideways, with the potential to advance in the area of 11.80. The PMO bottomed in oversold territory last month, and that is a good base for a rally.
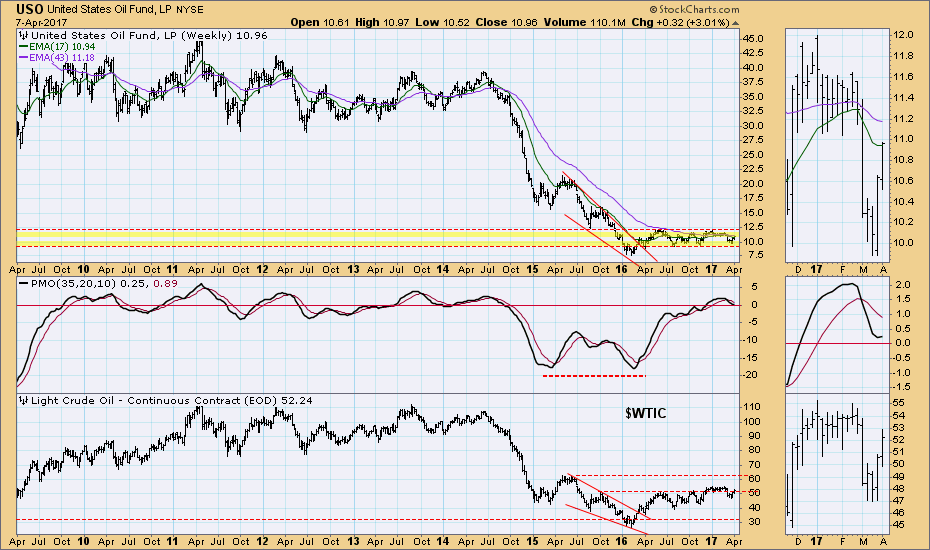
I find it useful to compare weekly charts of USO and $WTIC because USO price incorporates the cost of continuously rolling over futures contracts. Also, we get to keep the proper perspective on the price of crude, which has been edging higher after the initial bounce in early-2016. I can see the potential for about $60/barrel, but the fundamental problem of oversupply would seem to argue against any major rally for crude oil.
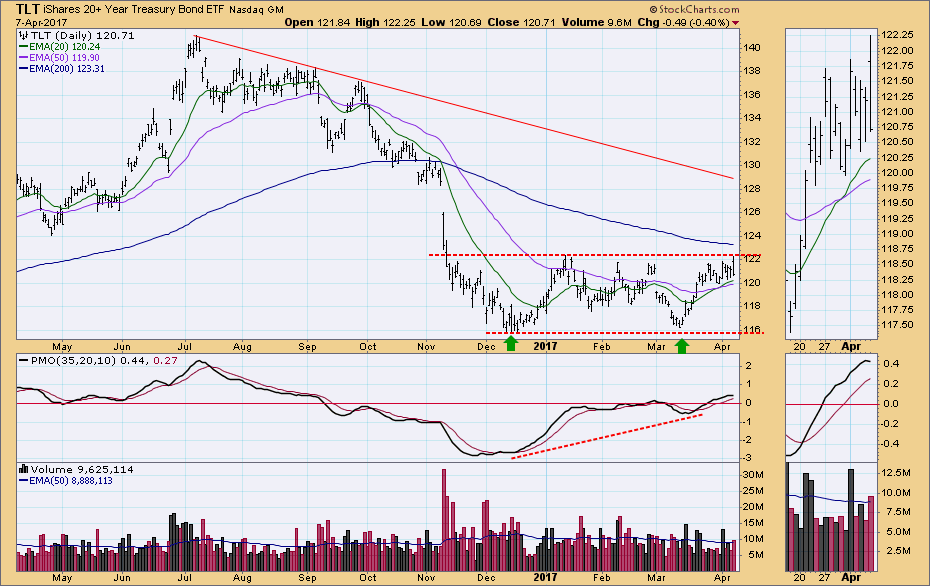
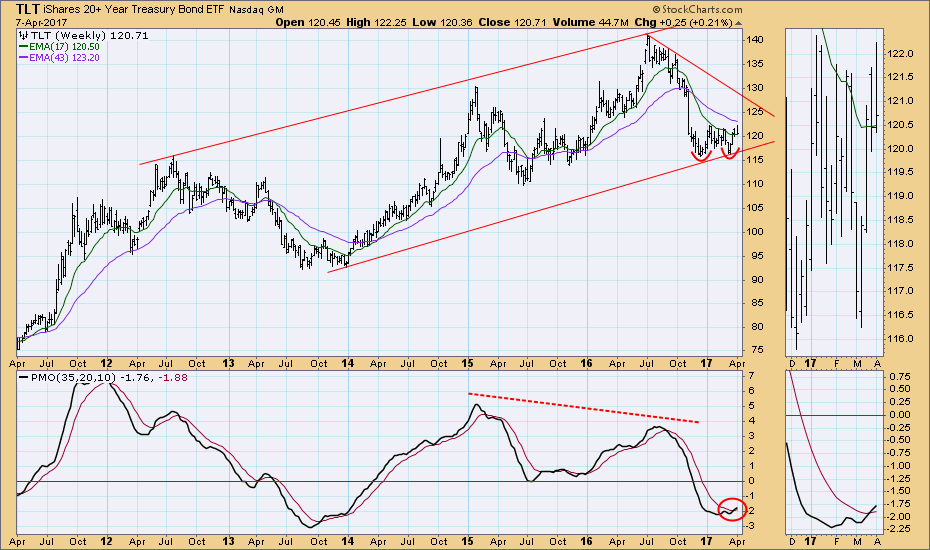
BONDS (TLT): As of 3/31/2017 the 20+ Year T-Bonds ETF (TLT) is on an Intermediate-Term Trend Model BUY signal. The Long-Term Trend Model, which informs our long-term outlook, is on a SELL signal as of 11/17/2016, so our long-term posture is bearish.
TLT remains within a five-month trading range, but there is a potential double bottom, which is accompanied by a PMO positive divergence. This sets up the potential for a break above the double bottom confirmation line.
The double bottom is also visible on the weekly chart, and the weekly PMO has crossed above its signal line. The technical picture for bonds is positive, in spite of probability of interest rate hikes later this year.
NOTE: The signal status reported herein is based upon mechanical trading model signals, specifically, the DecisionPoint Trend Model. They define the implied bias of the price index based upon moving average relationships, but they do not necessarily call for a specific action. They are information flags that should prompt chart review. Further, they do not call for continuous buying or selling during the life of the signal. For example, a BUY signal will probably (but not necessarily) return the best results if action is taken soon after the signal is generated. Additional opportunities for buying may be found as price zigzags higher, but the trader must look for optimum entry points. Conversely, exit points to preserve gains (or minimize losses) may be evident before the model mechanically closes the signal.
The DecisionPoint LIVE Shared ChartList has launched! Click on the link and you'll find webinar and blog chart spotlights. Be sure and bookmark it!
Technical Analysis is a windsock, not a crystal ball.
Happy Charting!
- Carl