During today's MarketWatchers LIVE show (12:00p - 1:30p EST MWF), Tom will review and annotate ten charts in ten minutes at ten minutes to one. We call it the "Ten in Ten to One". One of the first charts he reviewed was Ionis Pharmaceuticals (IONS) which we both agreed looked pretty good right now. You'll find my analysis below.
Support is holding well at the $38 range. There are quite a few bullish features to this chart.
1) A rounded bottom is typically bullish with the expectation to see higher prices.
2) It appears that the rounded bottom is also a double-bottom. This is a bullish formation. The pattern executes when price breaks out above the neckline of the pattern (horizontal resistance drawn from top at middle of the "W"). We can see that price broke out and has remained above.
3) You could also make a case for a possible flag formation with the pole starting at the April low and the flag being the recent consolidation. It would execute with a breakout into the 'gap zone'. The minimum upside target, calculated adding the length of the pole to the breakout point. This would put price around $46-$47.
3) There is a recent Price Momentum Oscillator (PMO) BUY signal in somewhat oversold territory. I like the rising OBV and high SCTR ranking.
4) The 5-EMA has crossed above the 20-EMA generating a ST Trend Model BUY signal and the 20-EMA is looking to cross above the 50-EMA which would set up an IT Trend Model BUY signal.
On the bearish side, I am concerned about resistance at the original gap in March. It is holding strong. However, if price can breakout, I would look for price targets at the November high ($48) or better yet, last December and March's highs around $57.
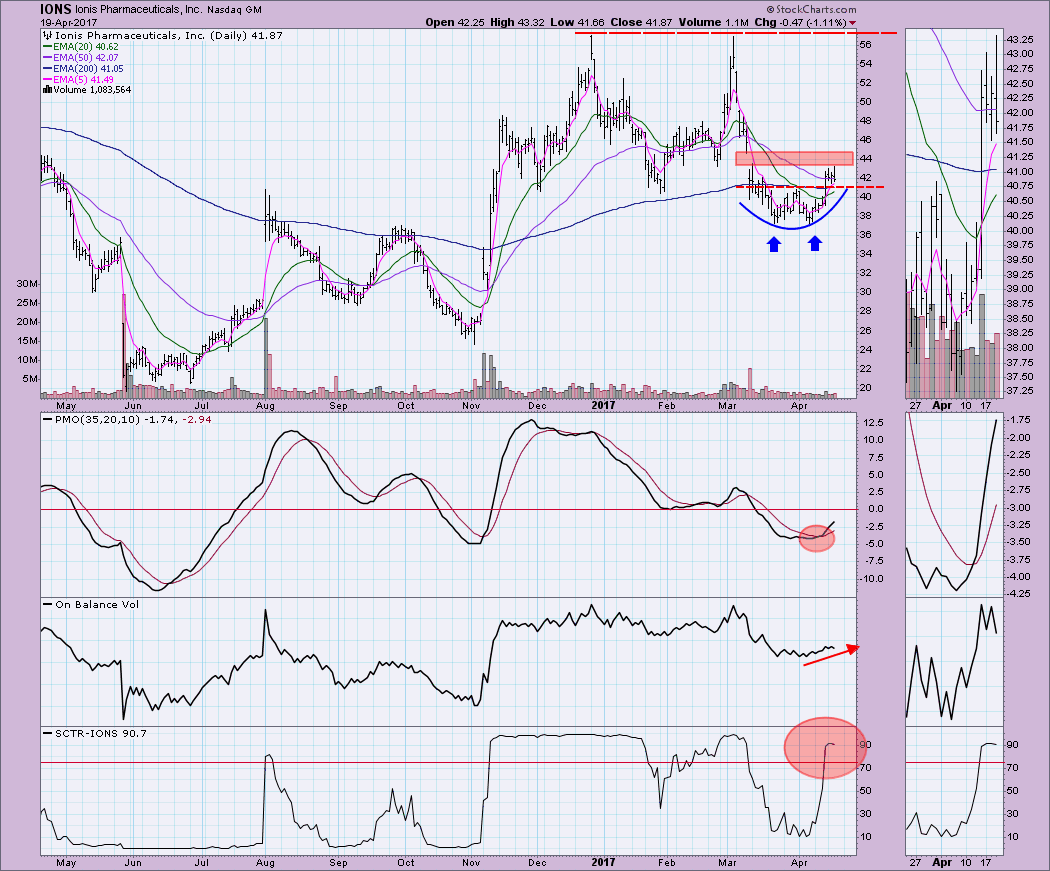
Conclusion: I would set stops below $37 and look for a price target of $48. After that I would re-evaluate. This is an attention flag, not a trading recommendation.
The DecisionPoint LIVE Shared ChartList is available now! Click on the link and you'll find all your favorite DP charts all annotated! Be sure and bookmark it!
Technical Analysis is a windsock, not a crystal ball.
Happy Charting!
- Erin