About three weeks ago I began looking for the market to consolidate or correct because of price being very overbought based upon its extreme departure from the 200EMA. So far we have two weeks of price churning sideways, and that has gotten the technical indicators in a condition that promises more of the same, if not an outright correction. Let's take a closer look.
The DecisionPoint Weekly Wrap presents an end-of-week assessment of the trend and condition of the stock market (S&P 500), the U.S. Dollar, Gold, Crude Oil, and Bonds.
STOCKS
IT Trend Model: BUY as of 11/15/2016
LT Trend Model: BUY as of 4/1/2016
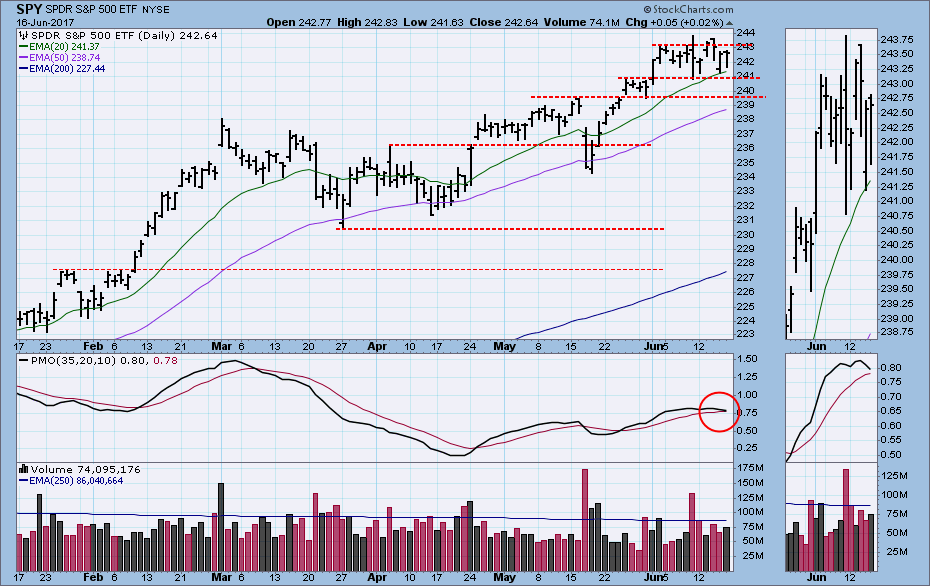
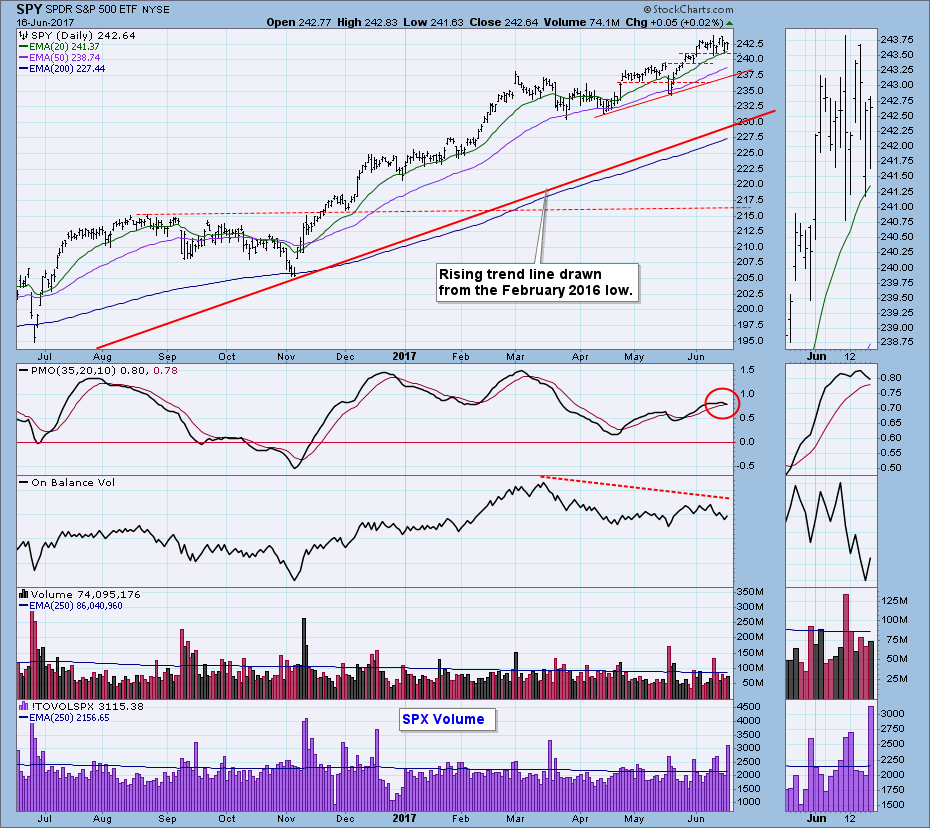
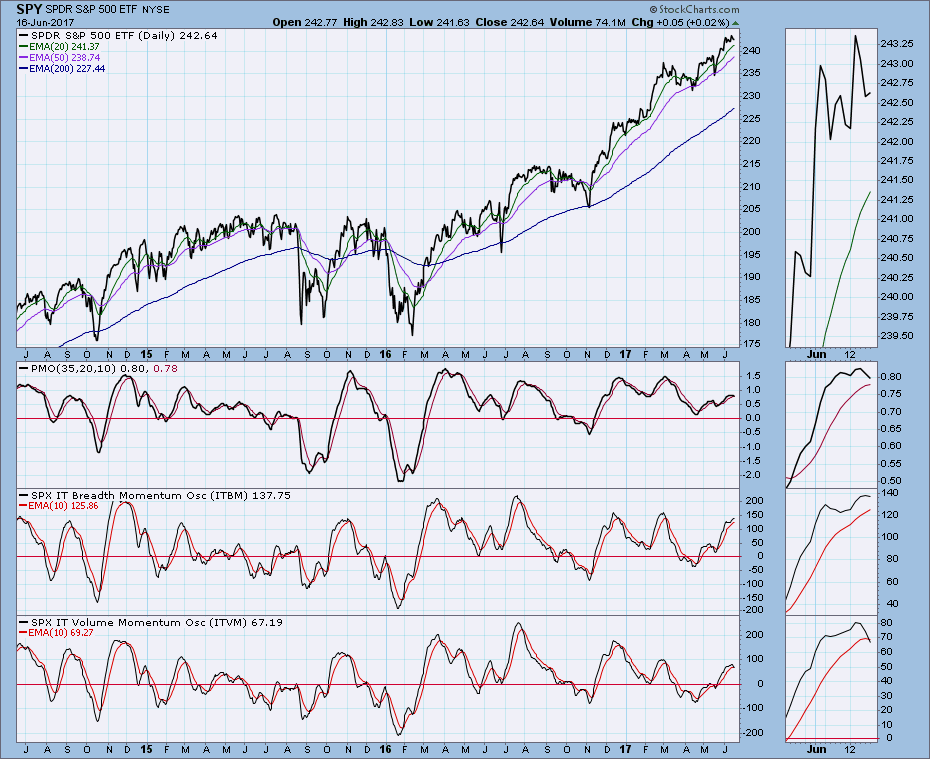
The rising trend line drawn from the February 2016 low defines the current cyclical bull market, and price departure from that line provides one measure of how overbought the market is. Price departure has not reached the extremes of July 2016 or March 2017, but it is still pretty stretched. However, for the last two weeks sideways price movement has relieved a little bit of the pressure. With the daily PMO topping, my best guess is that price will continue to move in a corrective manner for a few more weeks. Note the high S&P 500 volume on Friday -- a byproduct of options expiration.
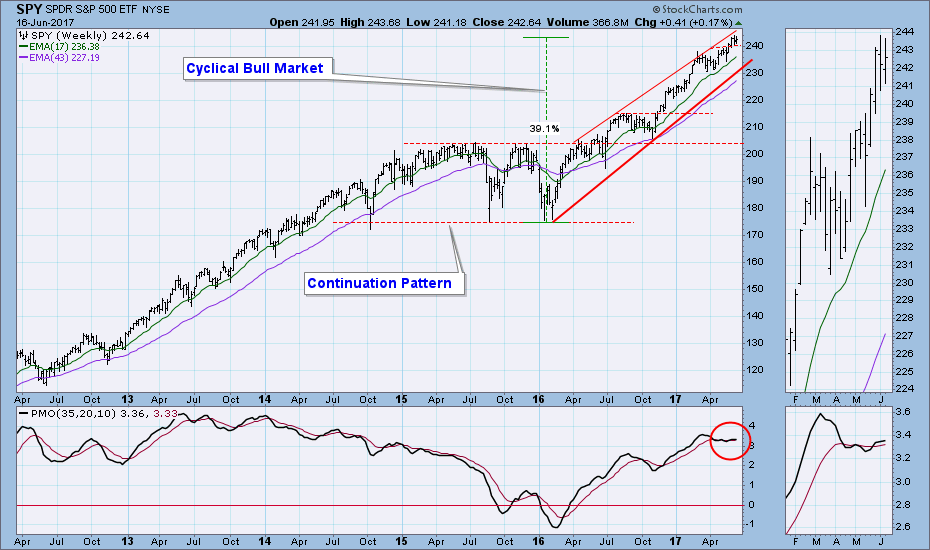
The weekly PMO is essentially moving sideways, whipsawing up and down. It is not an encouraging configuration, considering that it presents a divergence against rising price.
Short-Term Market Indicators: These indicators have topped, implying that more corrective action is likely in this time frame. The STO-V (volume) looks especially weak.
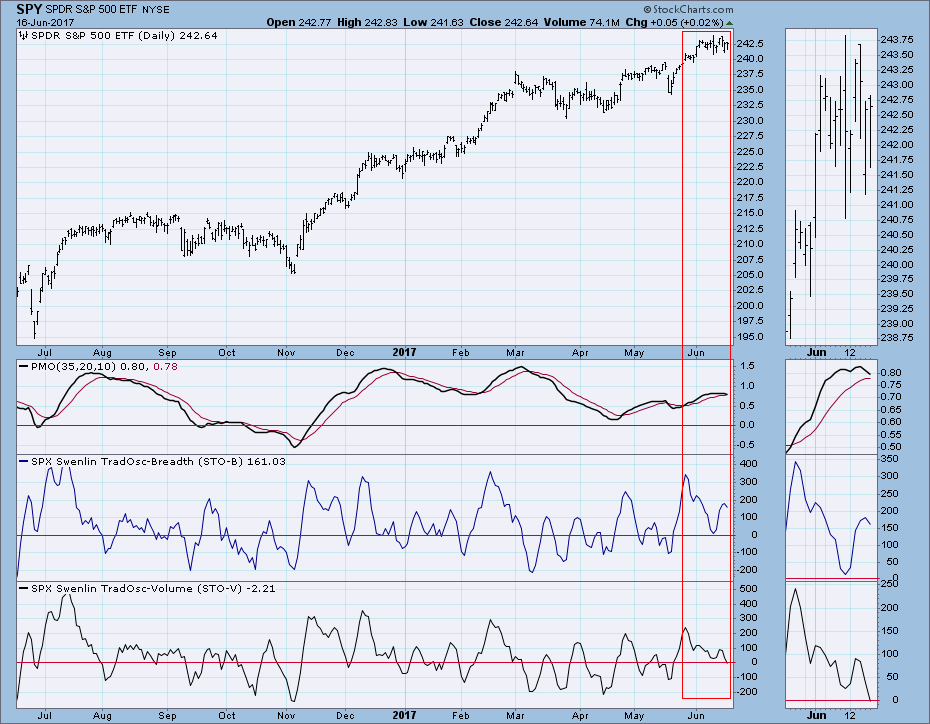
Intermediate-Term Market Indicators: These indicators are somewhat overbought, and they have topped. This configuration implies continued corrective price movement in this time frame.
Conclusion: There were two events this week that tended to keep the market less volatile -- the Fed announcement on Wednesday and Options expiration on Friday. During the last two weeks of consolidation, the market has been showing great reluctance to enter into any kind of decline. There were a couple of days where we started to see some selling, but it dried up before the close. This does not preclude having problems develop in the near future. Our primary short- and intermediate-term indicators are looking dismal, and my assumption is that at the very least the sideways churning will continue for another week or two. Considering the difficulties in the technology sector, the consolidation could morph into a correction rather quickly.
DOLLAR
IT Trend Model: NEUTRAL as of 3/21/2016
LT Trend Model: SELL as of 5/24/2017
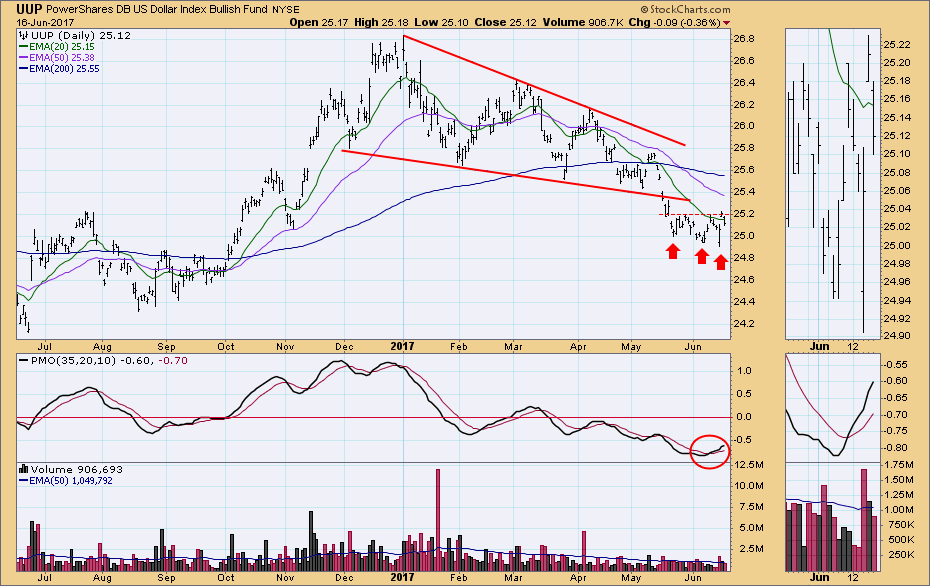
Thanks to a brief UUP down spike on Wednesday we now have a triple bottom. There is no question that UUP is having trouble getting above the thin line of resistance that has formed above the recent consolidation. The PMO is rising above its signal line, but the overall impression of this chart is negative.
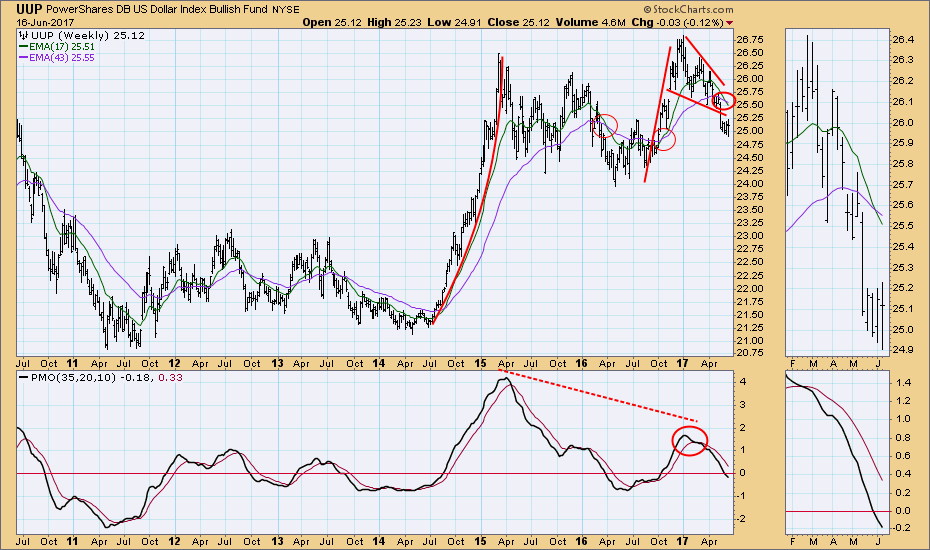
The weekly 17/43EMA downside crossover could be a sign that the down move may be temporarily exhausted, and a bounce is possible. But the negative resolution of the positive pennant formation makes me think any bounce will be short-lived.
GOLD
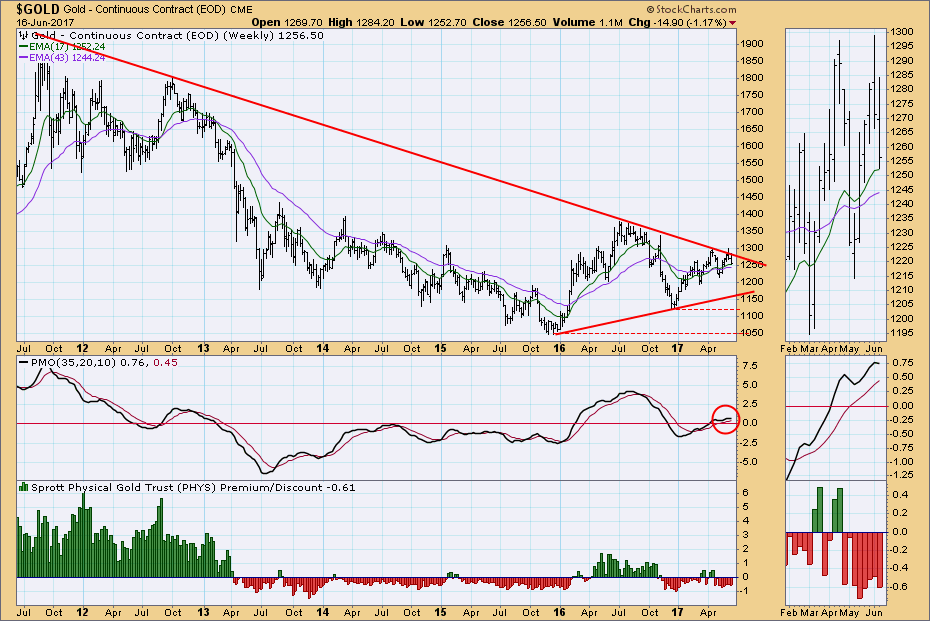
IT Trend Model: BUY as of 5/22/2017
LT Trend Model: BUY as of 4/12/2017
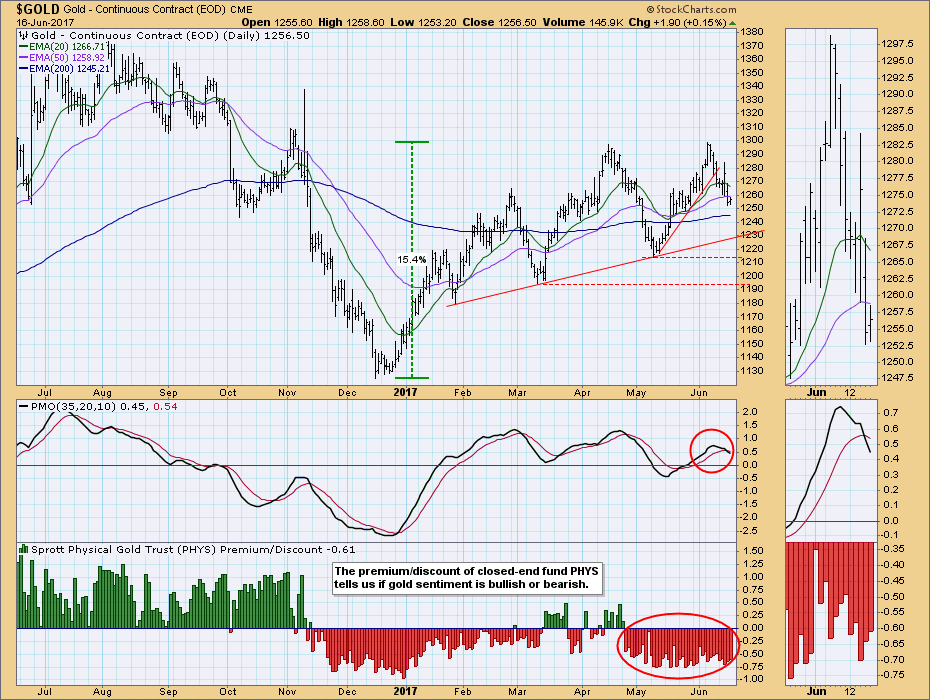
There was some gold price volatility on Wednesday associated with the Fed announcement, but in the end the short-term down trend continued. The Trend model BUY signals have endured, and they should continue to endure a while longer unless the down trend gets out of hand. A PMO SELL signal was generated on Thursday. The trend for most of 2017 has been sideways and slightly up. This kind of price action tends to produce a lot of signal whipsaw.
The weekly PMO has topped again, but that is a product of the sideways price action mentioned above. After a failed breakout the week before, price is definitely below the long-term declining tops line now. In spite of some problems, I remain positive on gold, though not wildly so.
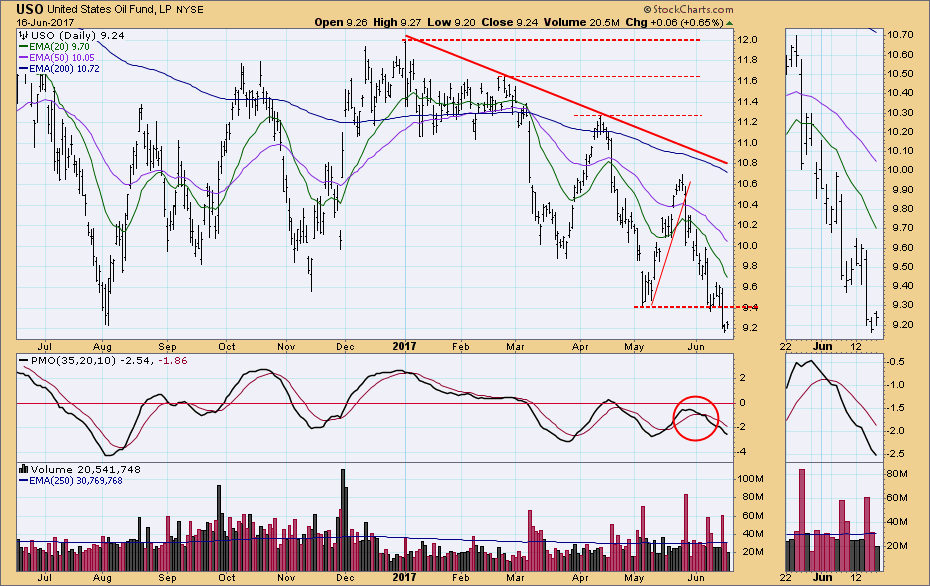
CRUDE OIL (USO)
IT Trend Model: NEUTRAL as of 3/8/2017
LT Trend Model: SELL as of 3/9/2017
Another bad week for crude as USO dropped down to levels not seen since August of last year.
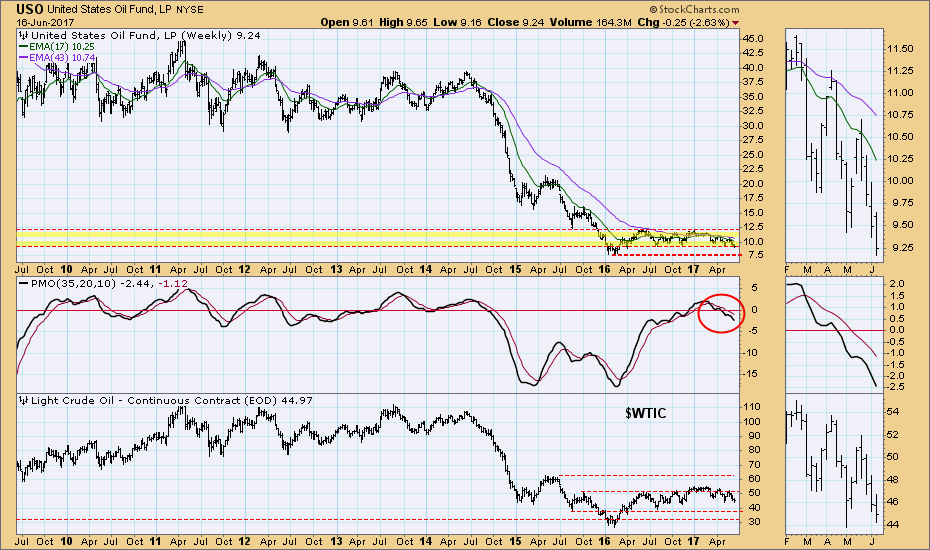
On the weekly chart we can see that the one-year support level is being challenged, and $WTIC will have to decline farther in order to reach a corresponding level of support. (To clarify, USO reflects the contract rollover drag that results from maintaining a portfolio of futures contracts, so it will lag a chart of raw contract prices.) The weekly PMO still looks dismal, and it is possible that USO will be challenging long-term support at 7.50.
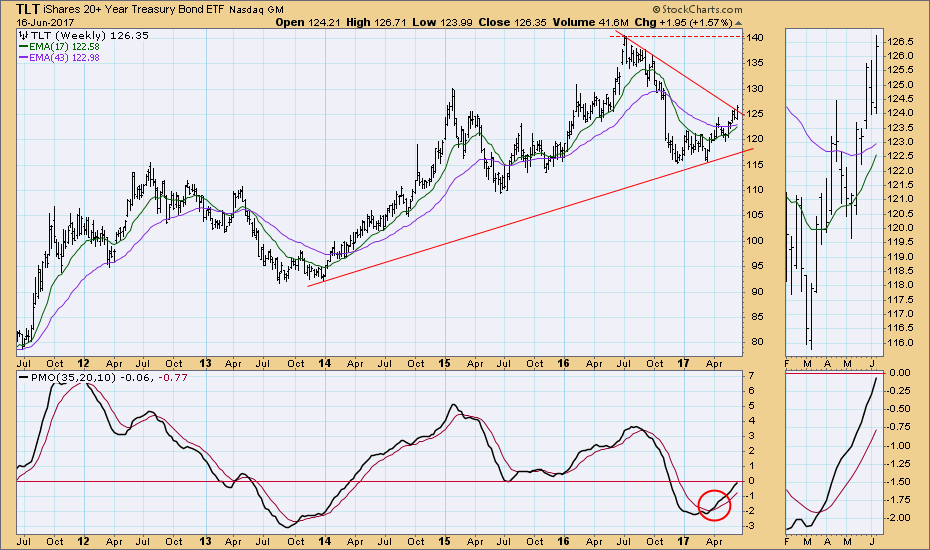
BONDS (TLT)
IT Trend Model: BUY as of 3/31/2017
LT Trend Model: BUY as of 6/16/2017
On Friday the 50EMA crossed up through the 200EMA generating a Long-Term Trend Model BUY signal. Also, this week, the same week the Fed raised interest rates a notch, price broke above the one-year declining tops line. Higher rates usually result in lower bond prices, but TLT is an ETF surrogate for long-term bonds, so price action could be reflecting the belief that the Fed's rate increase schedule will not immediately affect prices on longer-term bonds.
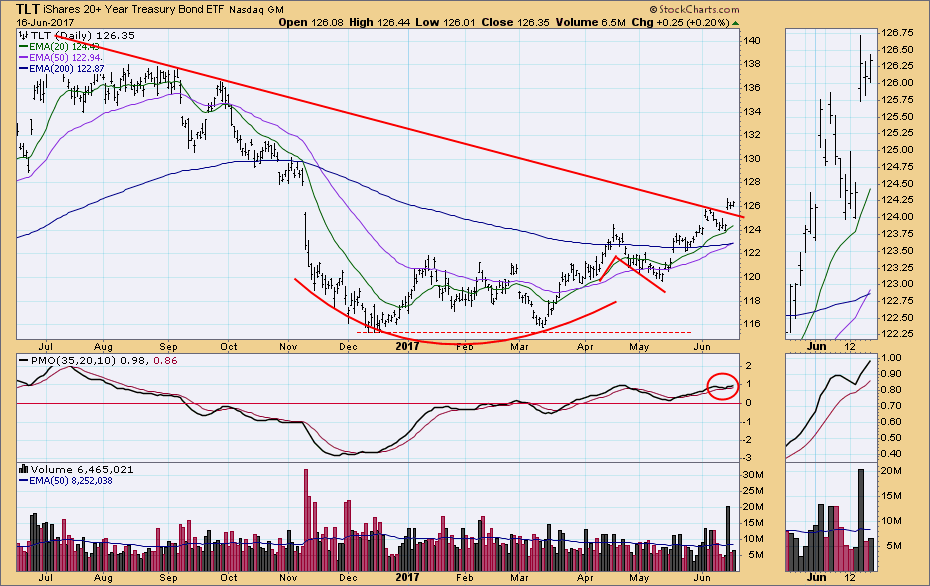
The weekly PMO is robustly bullish.
**Don't miss the DecisionPoint Alert Daily Commentary! Go to the "Notify Me" box toward the end of this blog page to be notified as soon as it is published at the end of the market day.**
Technical Analysis is a windsock, not a crystal ball.
Happy Charting!
- Carl
NOTE: The signal status reported herein is based upon mechanical trading model signals, specifically, the DecisionPoint Trend Model. They define the implied bias of the price index based upon moving average relationships, but they do not necessarily call for a specific action. They are information flags that should prompt chart review. Further, they do not call for continuous buying or selling during the life of the signal. For example, a BUY signal will probably (but not necessarily) return the best results if action is taken soon after the signal is generated. Additional opportunities for buying may be found as price zigzags higher, but the trader must look for optimum entry points. Conversely, exit points to preserve gains (or minimize losses) may be evident before the model mechanically closes the signal.
Helpful DecisionPoint Links:
DecisionPoint Shared ChartList and DecisionPoint Chart Gallery
Price Momentum Oscillator (PMO)
Swenlin Trading Oscillators (STO-B and STO-V)