During today's MarketWatchers LIVE Show (12:00 - 1:30p MWF), the big news was the correction on Oil. Oil prices dropped more than 5 percent after the government reported an unexpected increase in crude inventories. After global producers cut inventories, the hope had been that supplies would lessen the current "glut", but it wasn't enough, which sent prices careening lower.
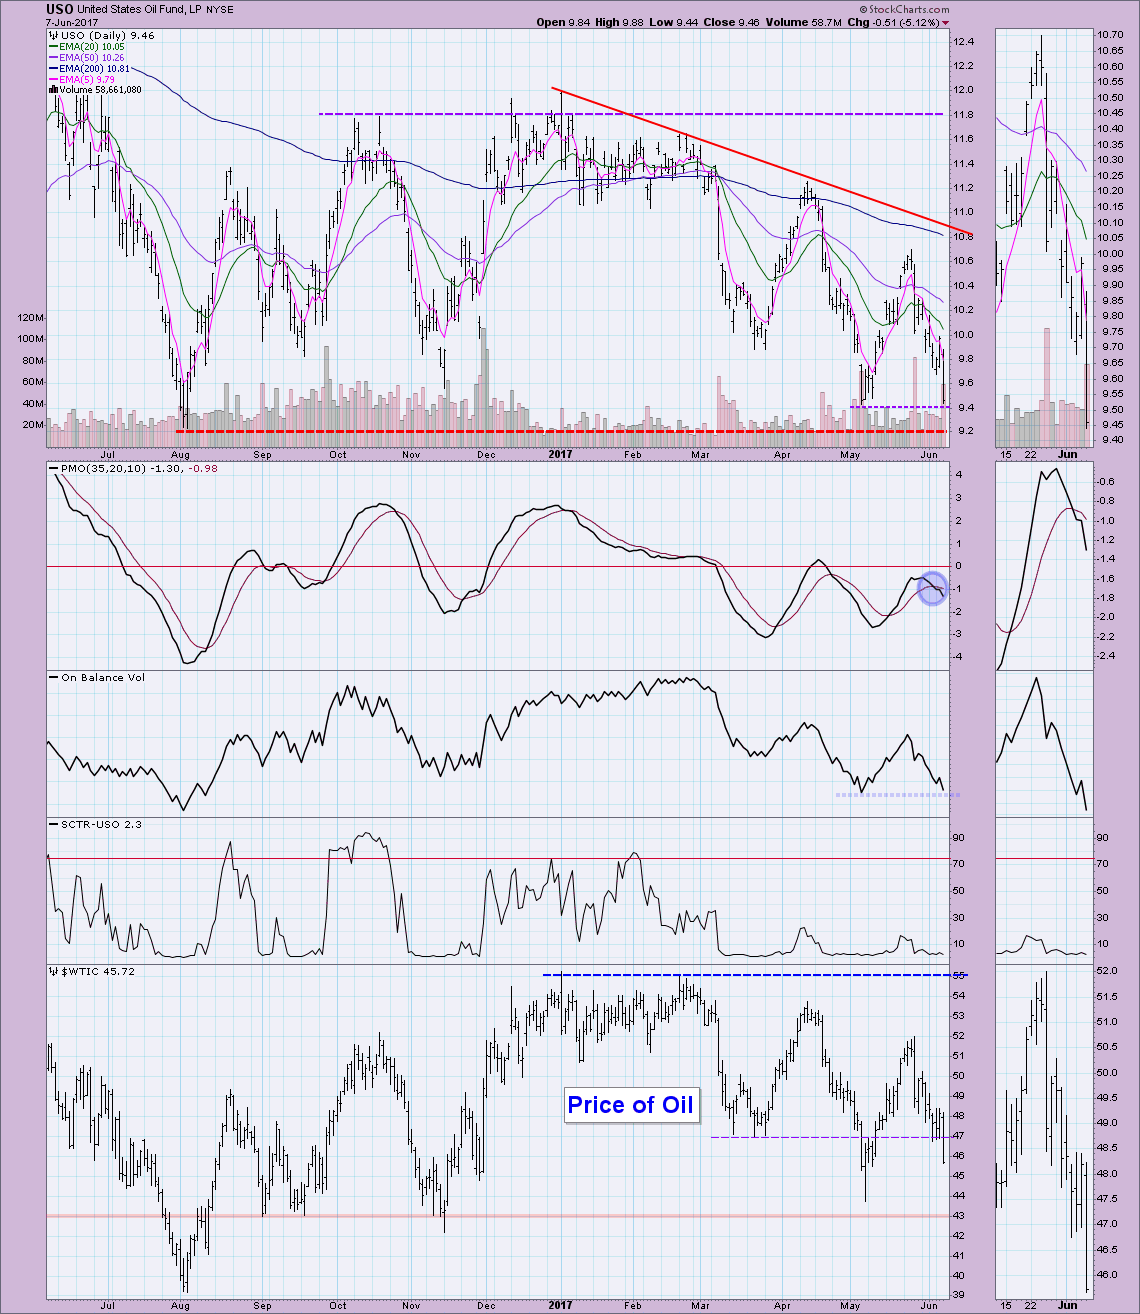
Of course with a breakdown of this magnitude and coming after an already deep decline, the question is whether we've hit a bottom. Looking at the daily chart below, I'm bothered by a number of things. The Trend Models are configured as negatively as possible with the faster EMAs on the bottom. The PMO triggered a SELL signal and the SCTR is abysmal. Notice that the last price top was unable to even reach overhead resistance along the declining tops trendline which was a sign of serious problems for USO. A short-term price bottom could be ready as price is now testing support at the last price low in March. The OBV could put in a positive divergence if we see a positive close tomorrow. However, for safety's sake, I would want to make sure this price level holds.
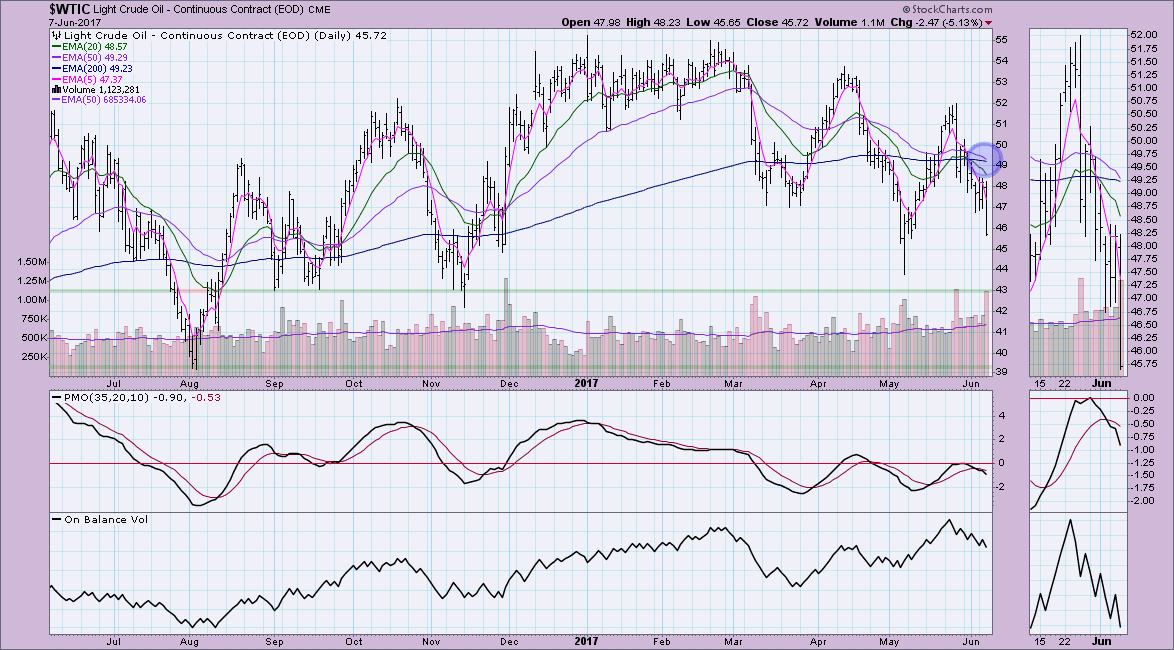
Here's a closer look at $WTIC. Unlike USO, it is technically in a "bull market" configuration with the 50-EMA > 200-EMA, however that could change very quickly as a negative crossover seems imminent. In the case of WTIC, there are certainly lower lows to test and $43 seems the likely stop.
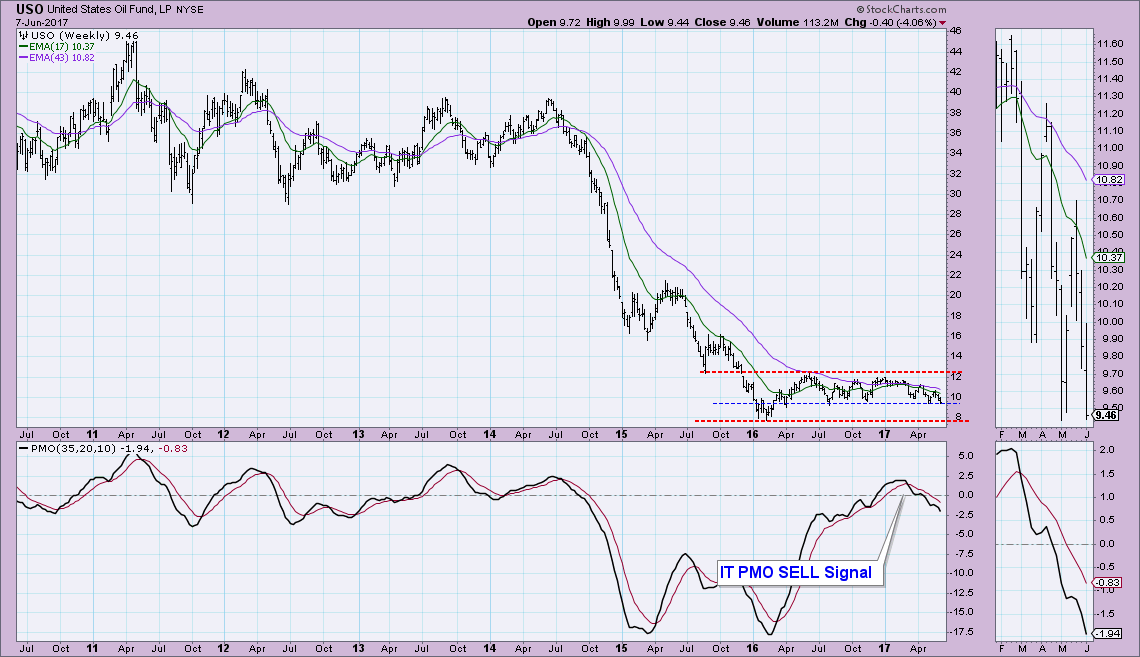
The weekly chart for USO demonstrates that right now, while we are holding support at the $9.20 level, there is another low that could be tested at $8. Also, the weekly PMO is headed lower after an earlier SELL signal.
Conclusion: This is a "decision point" for Oil and USO. A bottom could certainly be had at $45/barrel or $9.20 for USO, but knowing that an $8 level is up next if price doesn't hold. I would also find a rally right now to be somewhat suspect given the negativity of the indicators. There will be opportunity here, but I don't like the risk/reward right now on a volatile stock like USO. Patience could be rewarded.
Helpful DecisionPoint Links:
DecisionPoint Shared ChartList and DecisionPoint Chart Gallery
Price Momentum Oscillator (PMO)
Swenlin Trading Oscillators (STO-B and STO-V)
Technical Analysis is a windsock, not a crystal ball.
Happy Charting!
- Erin
**Don't miss DecisionPoint Commentary! Add your email below to be notified of new updates"**