Last week I said I expected to see new, all-time highs for SPY, and on Monday that expectation was fulfilled in a marginal way. While I didn't say I expected that the market would close higher this week, it was implied, but the market's low volume and lack of follow through on Tuesday, Wednesday, and Thursday made Friday's pullback not unexpected. It was assumed that Turkey's currency crisis pulled the plug, but the technicals were looking for it as well.
The DecisionPoint Weekly Wrap presents an end-of-week assessment of the trend and condition of the stock market (S&P 500), the U.S. Dollar, Gold, Crude Oil, and Bonds.
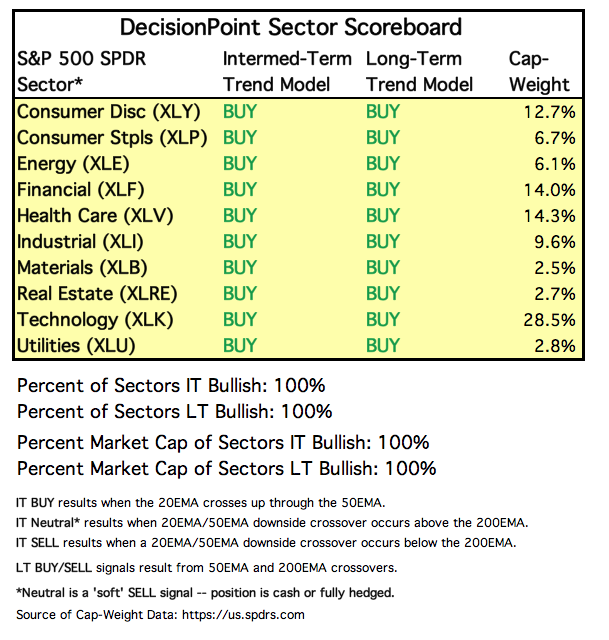
SECTORS
Each S&P 500 Index component stock is assigned to one, and only one, of 10 major sectors. This is a snapshot of the Intermediate-Term and Long-Term Trend Model signal status for those sectors.
STOCKS
IT Trend Model: BUY as of 5/11/2018
LT Trend Model: BUY as of 4/1/2016
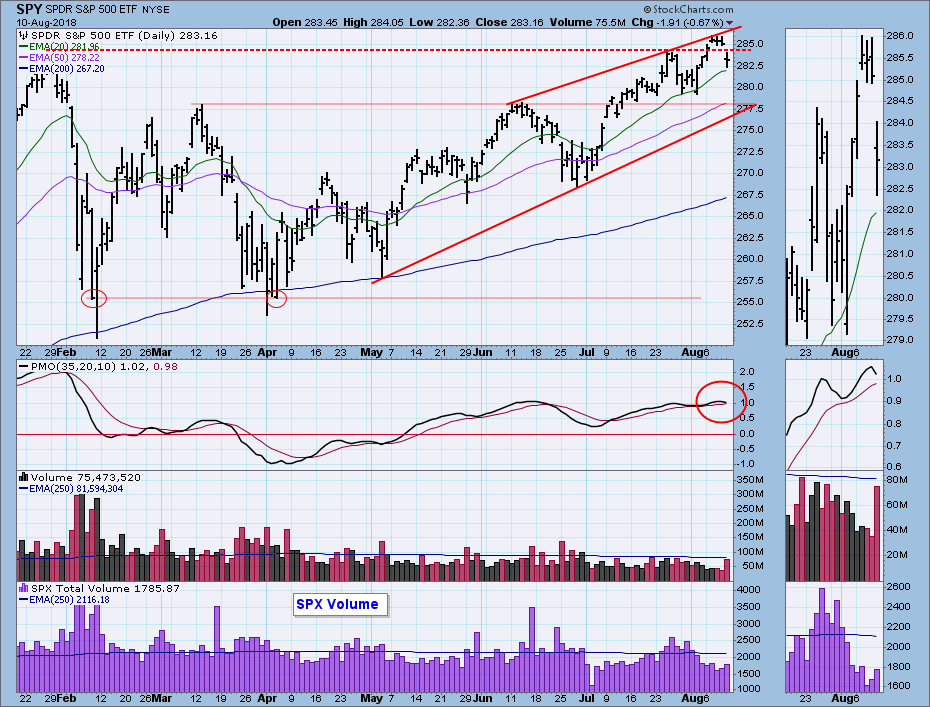
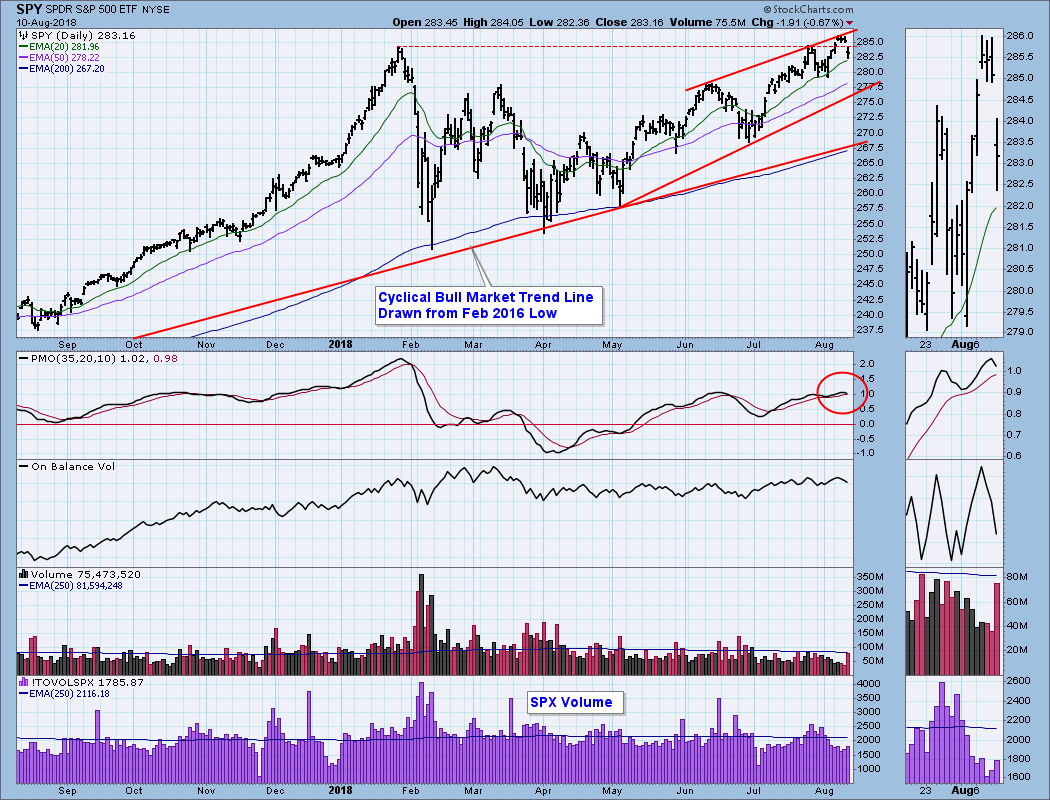
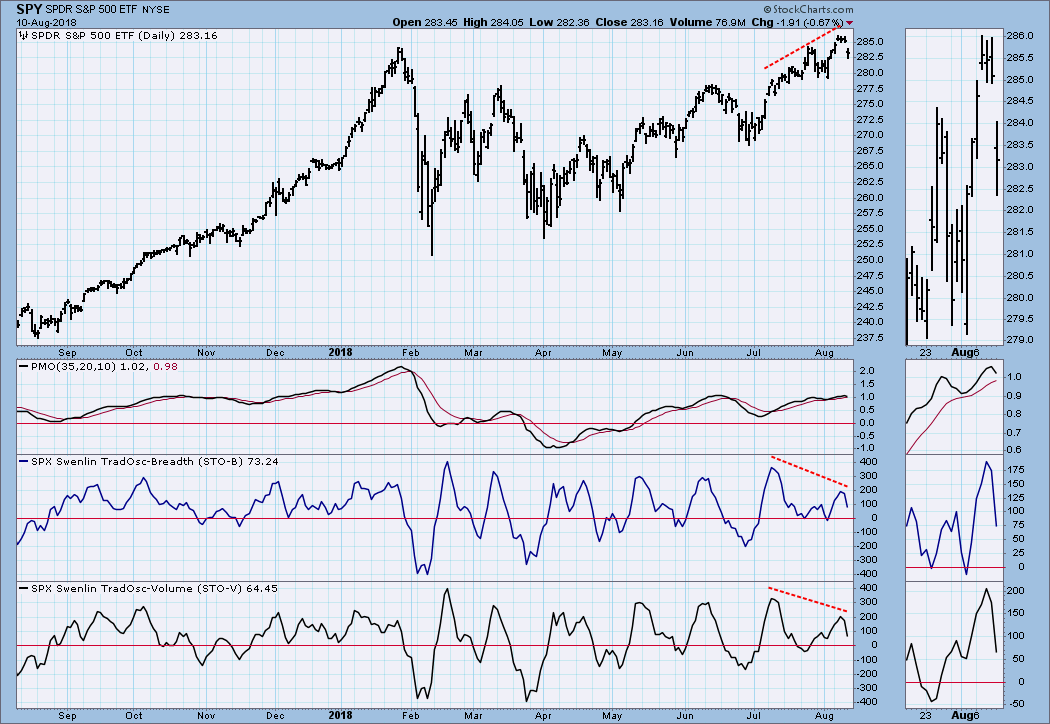
SPY Daily Chart: SPY hit new, all-time highs this week, but the gain was minuscule. (The S&P 500 did not make new, all-time highs, but that is because it is not adjusted for dividends, whereas SPY is.) As I watched the narrow range on low volume mid-week, I would have been surprised if there hadn't been some weakness on Friday. Volume was a little strange on Friday. SPY (the trading vehicle) volume was high, but total volume for stocks in the S&P 500 was still well below the one-year average.
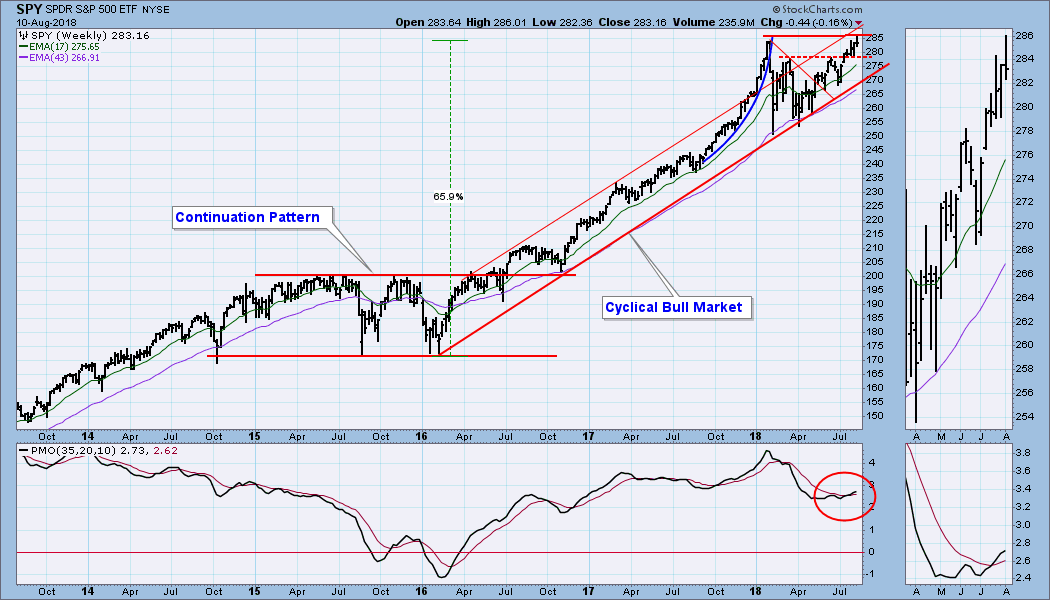
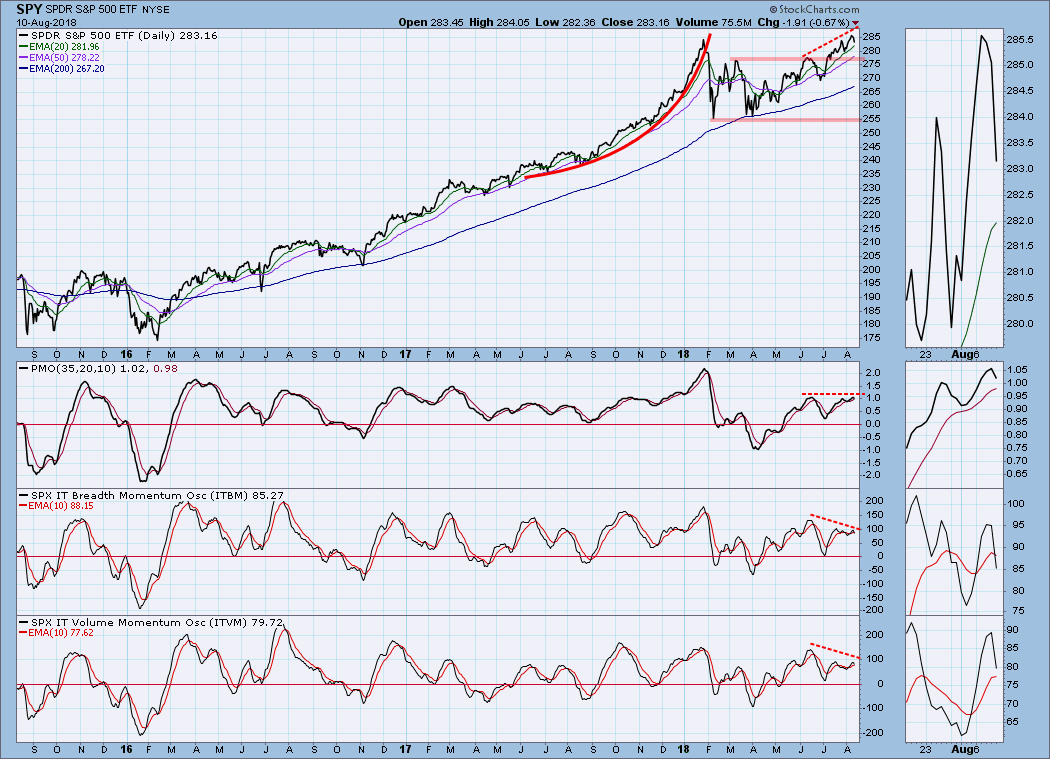
SPY Weekly Chart: This week's breakout was not decisive, and with some more pullback there is the possibility that we're looking at an important double top.
Short-Term Market Indicators: There are STO-B and STO-V negative divergences. The indicators are falling, and there is plenty of room for downside price movement before they become oversold.
Intermediate-Term Market Indicators: Negative divergences persist on our three primary intermediate-term indicators. They are all modestly overbought and can accommodate a lot of price decline before they become oversold.
Conclusion: Next week is options expiration, so we should expect relatively low volatility toward the end of the week; however, the currency crisis in Turkey has the potential to really upset markets worldwide, and it is the kind of thing that could sink the bull market in U.S. stocks. Don't misunderstand, I'm not saying that it will have that effect, it probably won't, but it is one of those 'out-of-left-field,' 'off-the-wall,' domino-effect events that we shouldn't take for granted.
Last week the market was looking bullish in the face of bearish indicators. This week the bearish indicators have not changed, but now the market has begun behaving badly. The chart immediately above gives a very good technical summary: the market is overbought, price is potentially forming a double top, and the negative divergences are unanimous. I am expecting weakness next week, and it could last a while.
DOLLAR (UUP)
IT Trend Model: BUY as of 4/24/2018
LT Trend Model: BUY as of 5/25/2018
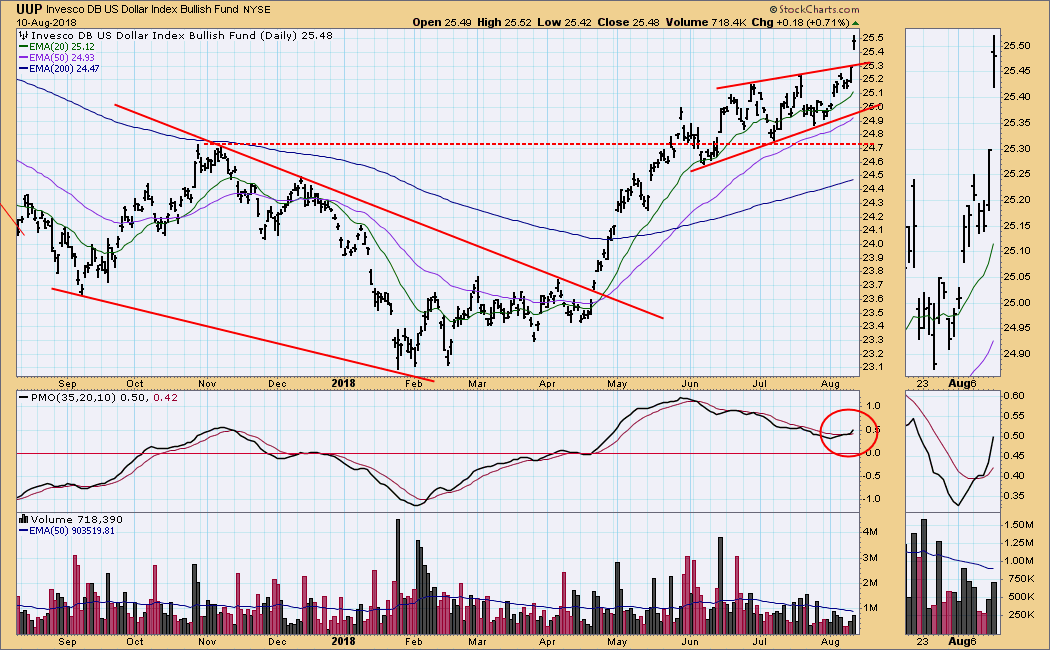
UUP Daily Chart: A bearish rising wedge formation, which formed over the last two months, implied that a pullback was likely, but the formation resolved upward, probably because of the currency crisis in Turkey. I say 'probably' because UUP is in a strong bull market, and bearish resolutions are less favored than they would be in a neutral or bear market.
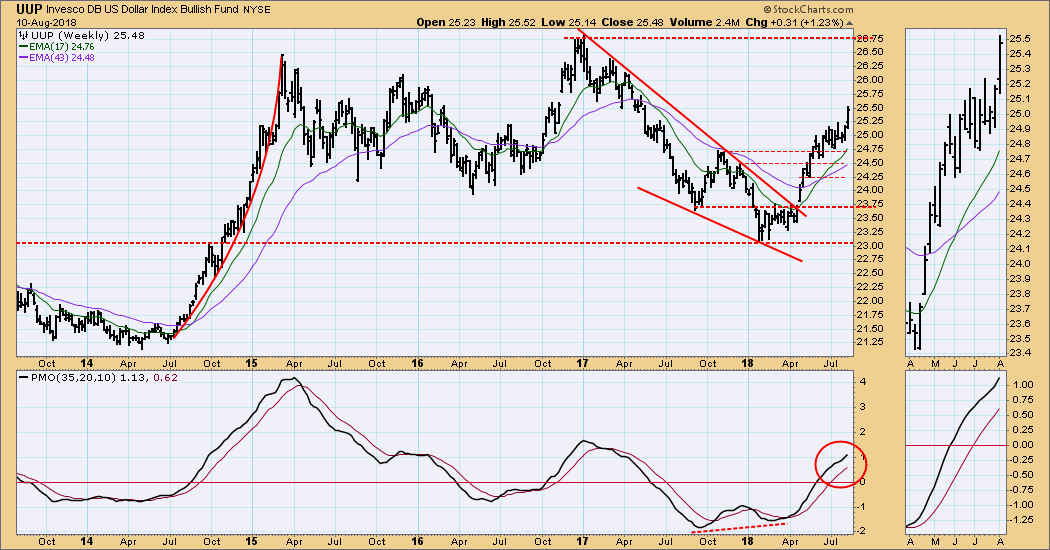
UUP Weekly Chart: In this time frame we can see that UUP is in a three-year trading range. It's not the most well-defined range I've ever seen, but it's clear enough to make me anticipate resistance at the top of the range.
GOLD
IT Trend Model: NEUTRAL as of 5/2/2018
LT Trend Model: SELL as of 6/22/2018
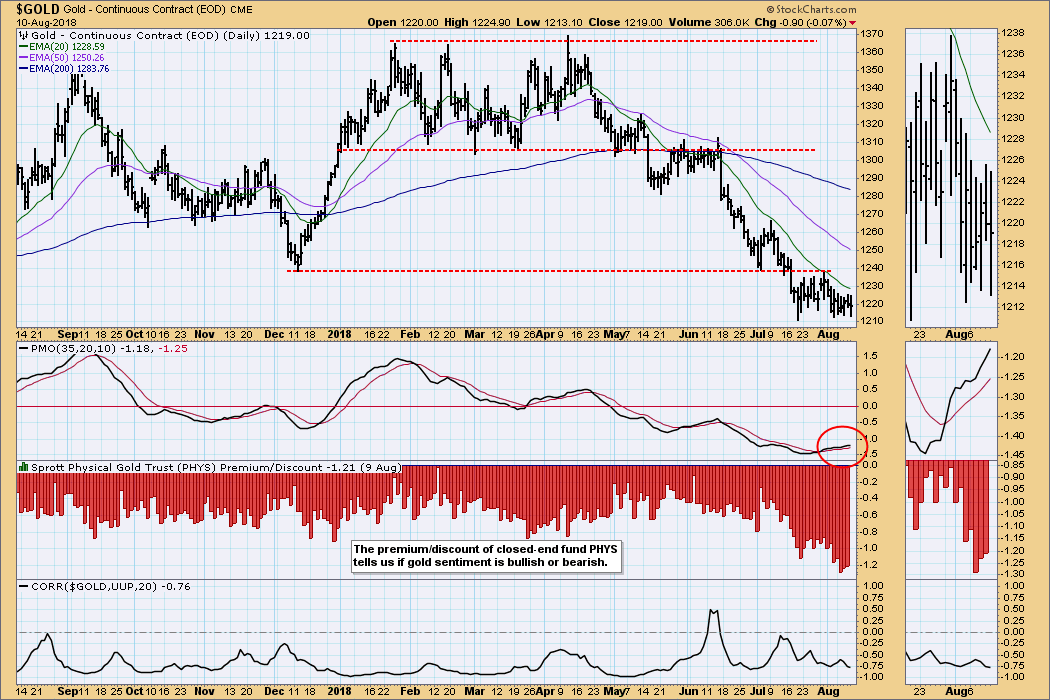
GOLD Daily Chart: The strong up move of the dollar on Friday would normally have caused a comparable loss for gold; however, gold held steady, probably because of the potential global turmoil resulting from currency instability. That is the kind of environment where gold can shine (so to speak).
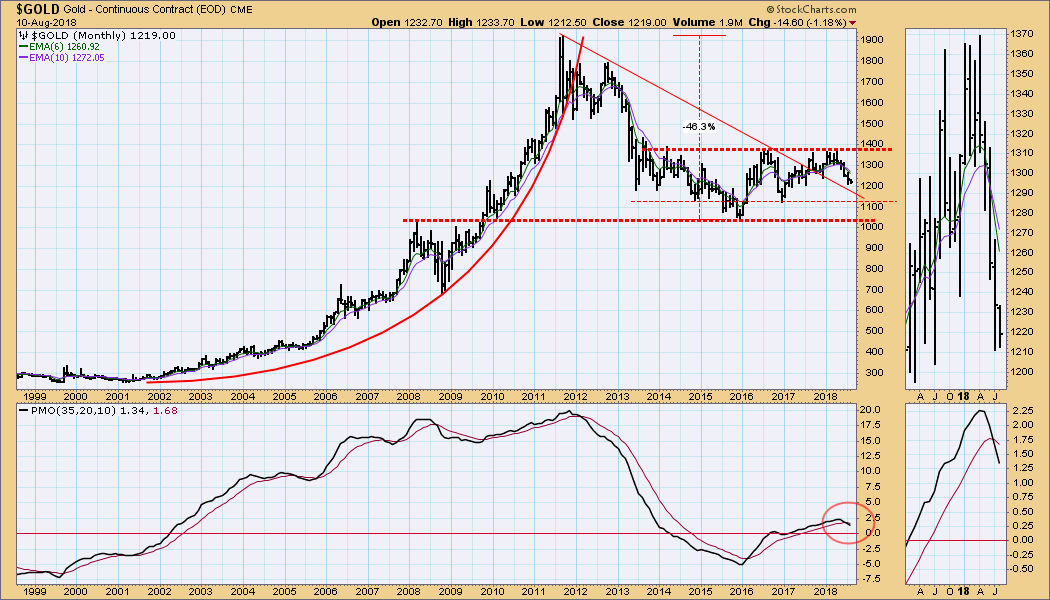
GOLD Monthly Chart: I decided to jump to the monthly time frame because it gives us a better view of the potential long-term support. Nevertheless, this chart is bearish because the moving averages and PMO are in a bearish configuration. Nothing is happening on the daily chart that would make me think this is going to turn around yet.
CRUDE OIL (USO)
IT Trend Model: BUY as of 6/26/2018
LT Trend Model: BUY as of 11/2/2017
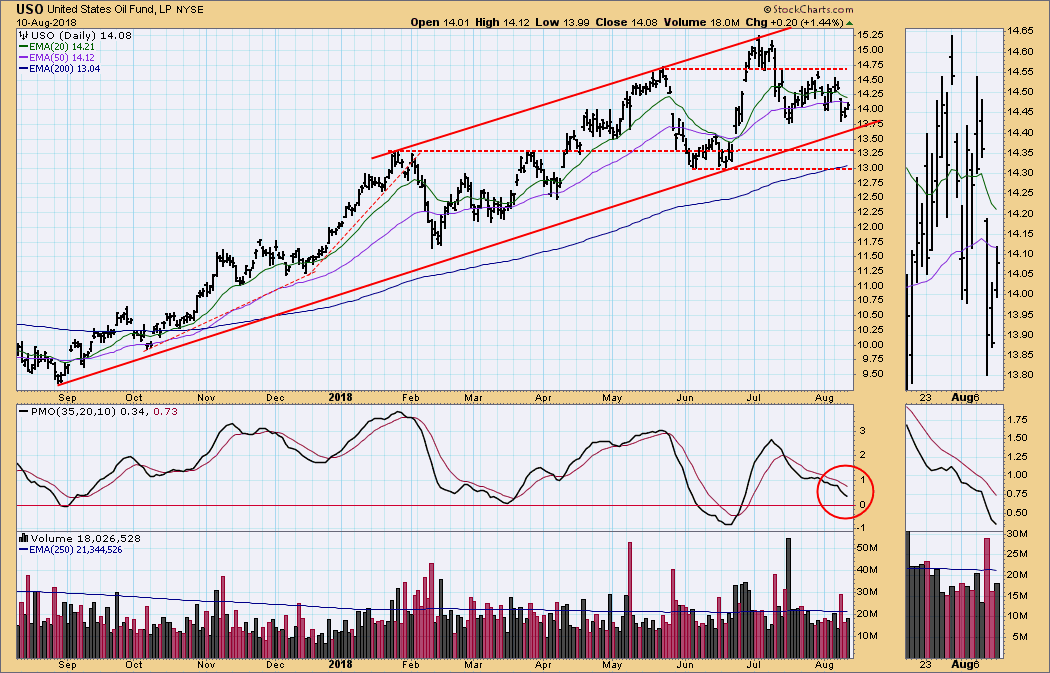
USO Daily Chart: USO is headed for the bottom of a rising trend channel, and the daily PMO is below the signal line and falling. If these conditions persist much longer, the 20EMA will pass down through the 50EMA, generating an IT Trend Model NEUTRAL signal.
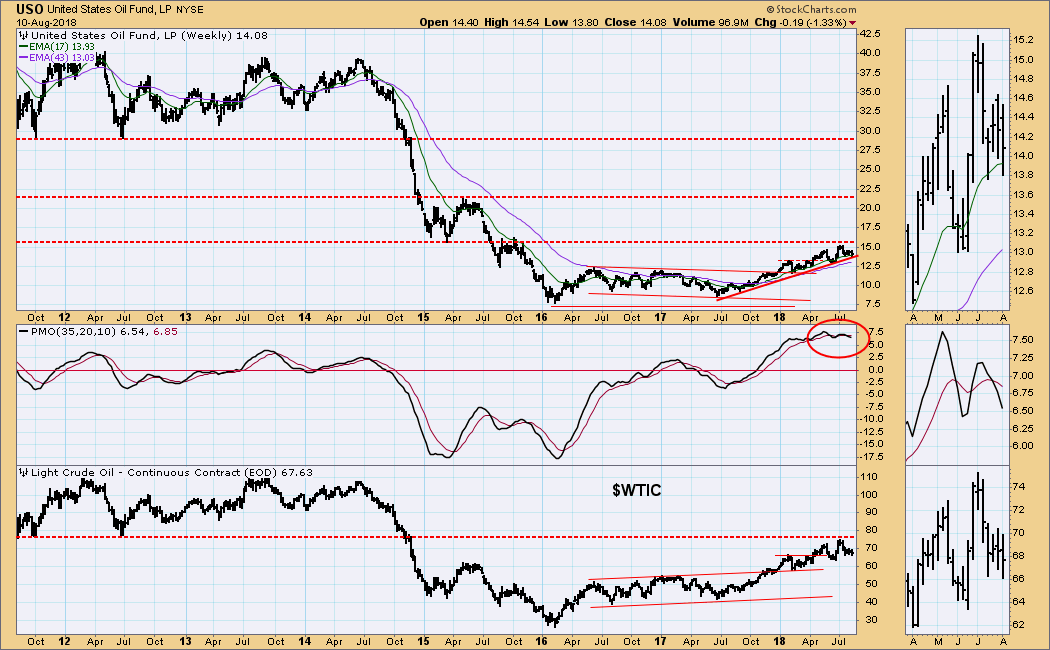
USO Weekly Chart: In this time frame we can see that $WTIC was turned back from long-term overhead resistance, so it is likely that USO has reached a level of resistance as well.
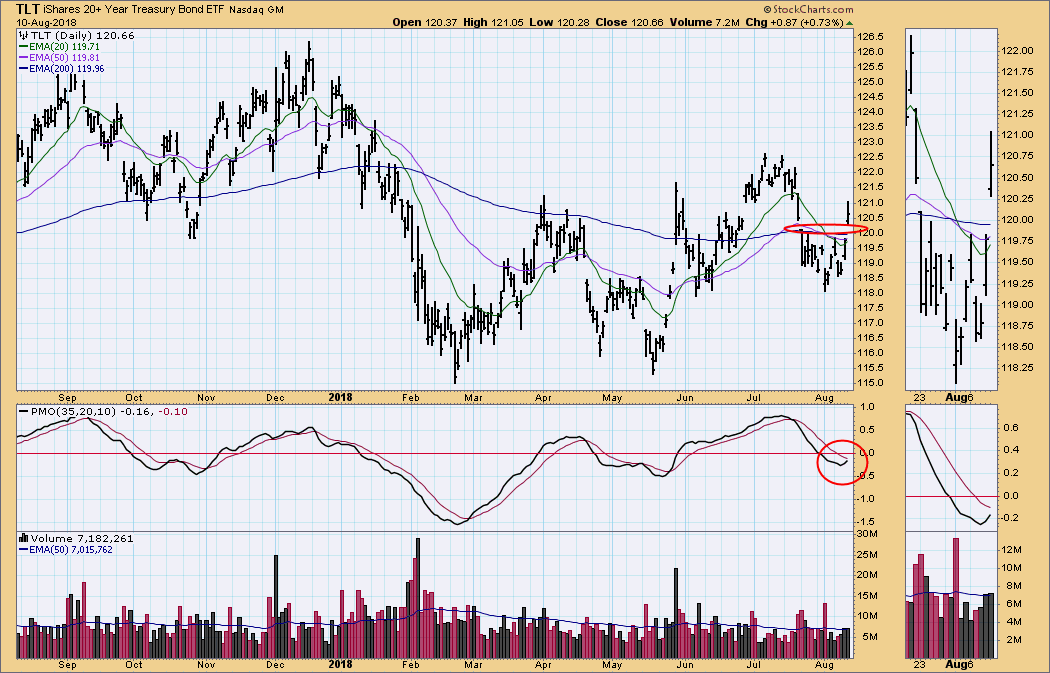
BONDS (TLT)
IT Trend Model: SELL as of 8/2/2018
LT Trend Model: SELL as of 8/1/2018
TLT Daily Chart: It now appears that the IT and LT SELL signals generated early this month will be changing back to BUY signals soon, because the breakdown in July was reversed on Friday, as TLT executed an island reversal, jumping above July's down gap. All the EMAs are very close together, so we can't be sure that any signal changes will stick.
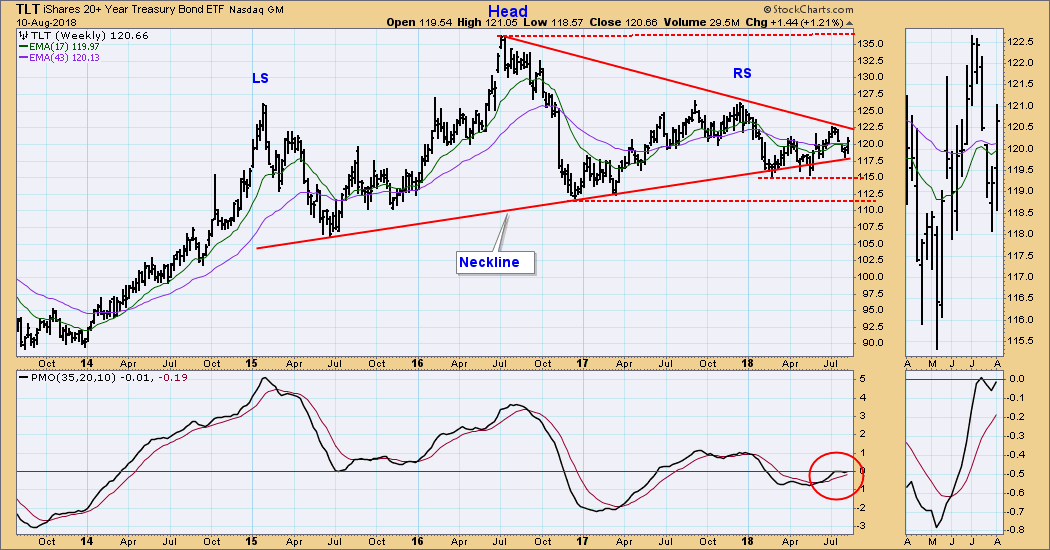
TLT Weekly Chart: The weekly PMO has turned up again, so the bearish head and shoulders pattern is again in jeopardy because an upside breakout might be next.
**Don't miss any of the DecisionPoint commentaries! Go to the "Notify Me" box toward the end of this blog page to be notified as soon as they are published.**
Technical Analysis is a windsock, not a crystal ball.
Happy Charting!
- Carl
NOTE: The signal status reported herein is based upon mechanical trading model signals, specifically, the DecisionPoint Trend Model. They define the implied bias of the price index based upon moving average relationships, but they do not necessarily call for a specific action. They are information flags that should prompt chart review. Further, they do not call for continuous buying or selling during the life of the signal. For example, a BUY signal will probably (but not necessarily) return the best results if action is taken soon after the signal is generated. Additional opportunities for buying may be found as price zigzags higher, but the trader must look for optimum entry points. Conversely, exit points to preserve gains (or minimize losses) may be evident before the model mechanically closes the signal.
Helpful DecisionPoint Links:
DecisionPoint Shared ChartList and DecisionPoint Chart Gallery
Price Momentum Oscillator (PMO)
Swenlin Trading Oscillators (STO-B and STO-V)