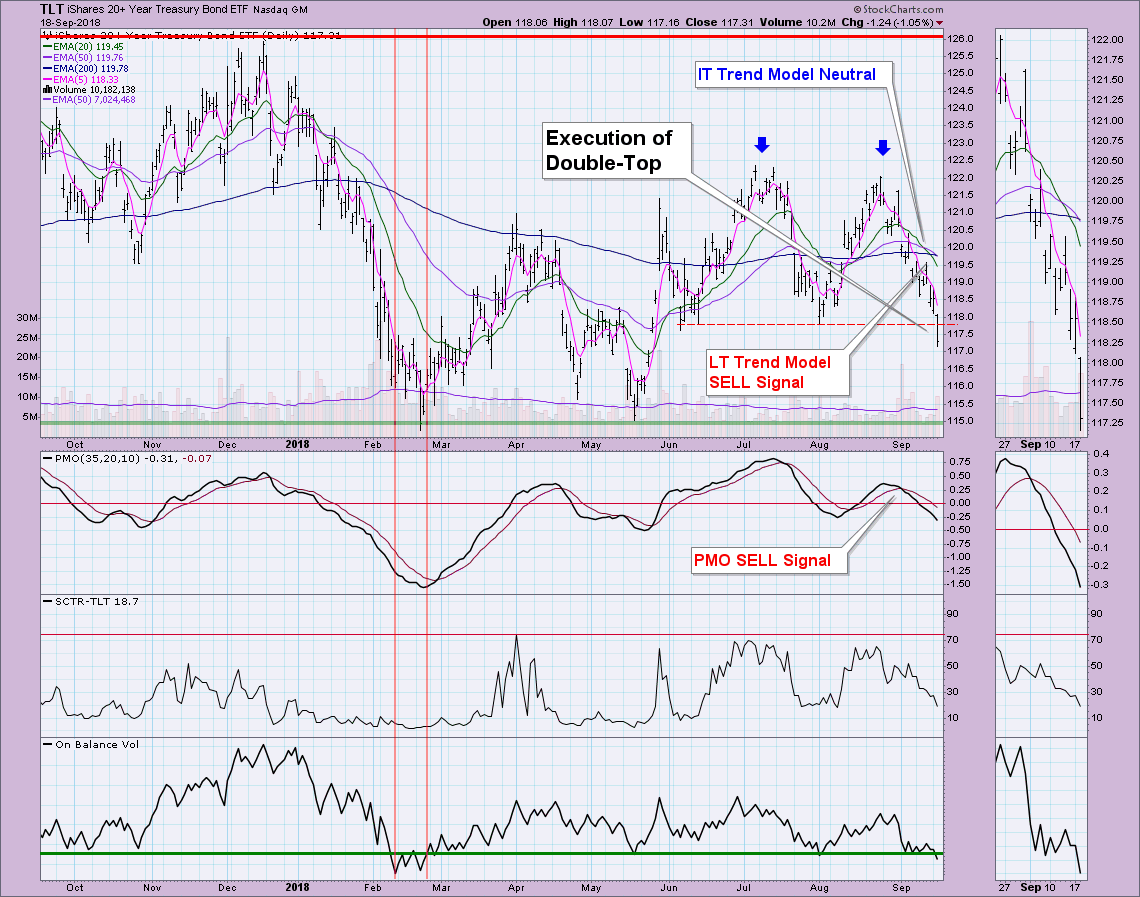
I've been trumpeting the bearish horn on TLT for some time, but today marked a series of unfortunate events for TLT. Just last week we saw a new IT Trend Model Neutral signal and today, we got the LT Trend Model SELL signal. Add to that the execution of a serious double-top and an IT PMO SELL signal lined up for Friday on the weekly chart and you have a recipe for a long deep decline.
There's a lot going on in this chart that you need to know about. When the 20-EMA crossed below the 50-EMA while both were above the 200-EMA, an Intermediate-Term Trend Model Neutral signal was born. Today, the 50-EMA crossed below the 200-EMA, this marks a Long-Term Trend Model SELL signal which DecisionPoint analysis calls a 'bear market' phase.
The next problem? Today price dropped below the confirmation line of the Double-Top formation, essentially executing and confirming the pattern. The minimum downside target for the double-top is determined by the height of the pattern. The height is $4.50, subtracted from the confirmation line at $117.75 gives us a minimum downside target of $113.25 (not on the chart).
Today we also saw the OBV drop below support. I've annotated the last time this happened back in February.
Final nail in the coffin, so to speak, would be the PMO SELL signal which executed last month. Since then the PMO has not hesitated on its way down.
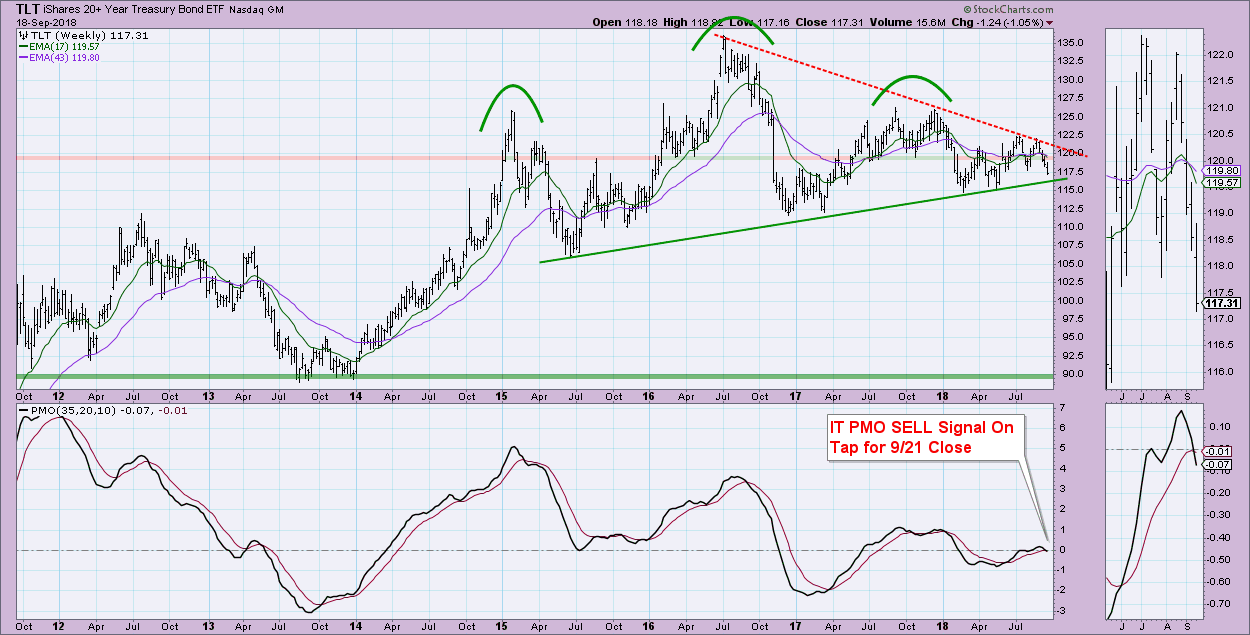
The weekly chart confirms bearish look of the daily chart. First, there is a PMO SELL signal on tap for Friday after the close. Currently it is reading as a SELL signal, but on weekly charts we don't log the signal until the the close of the final trading day of the week. The second problem is obvious...a very large head and shoulders pattern. It hasn't executed (or technically confirmed) the pattern with a breakdown below the upward sloping neckline.
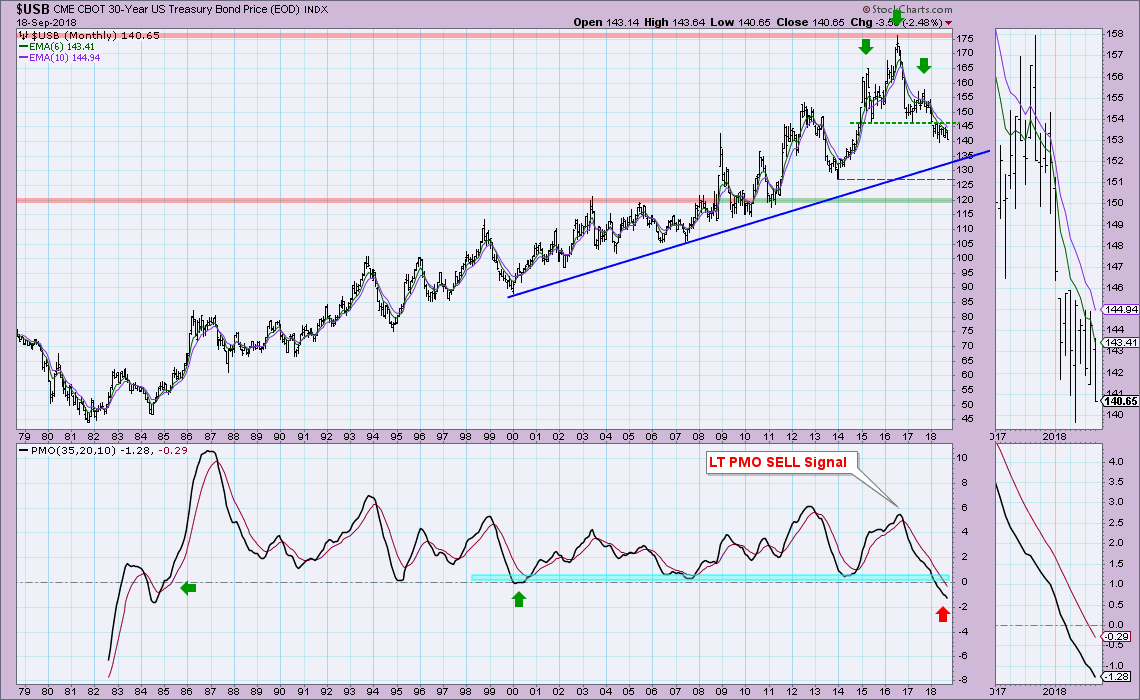
However, take a look at the 30-Year Bond Price monthly chart. We have a large head and shoulders pattern that actually did execute and confirm the pattern back in January.
Conclusion: TLT has moved officially into a 'bear market' configuration with the 50-EMA crossing below the 200-EMA. Long-term charts and indicators are confirming this. One caveat about the Trend Models, the EMAs on TLT are "braiding", sporting very close margins between each other. This can lead to whipsaw signals. We saw quite a few LT Trend Model signals this past year for that very reason. However, I wouldn't look for another LT BUY signal for some time. It would require price to get back above and stay above both the 50/200-EMAs. Negative momentum will make that an arduous task.
Technical Analysis is a windsock, not a crystal ball.
Happy Charting!
- Erin
Helpful DecisionPoint Links:
DecisionPoint Shared ChartList and DecisionPoint Chart Gallery
Price Momentum Oscillator (PMO)
Swenlin Trading Oscillators (STO-B and STO-V)
**Don't miss DecisionPoint Commentary! Add your email below to be notified of new updates"**