Don't Ignore This Chart! October 30, 2009 at 02:43 PM
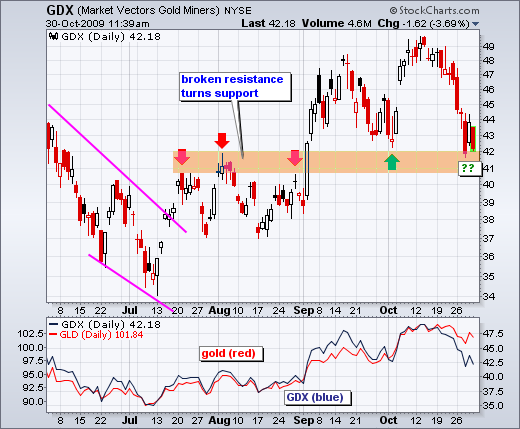
The Gold Miners ETF (GDX) is in for a big test as broken resistance turns into support. GDX broke resistance around 41-42 with a big surge in September. This level turned into support, and held, in early October... Read More
Don't Ignore This Chart! October 29, 2009 at 01:34 PM
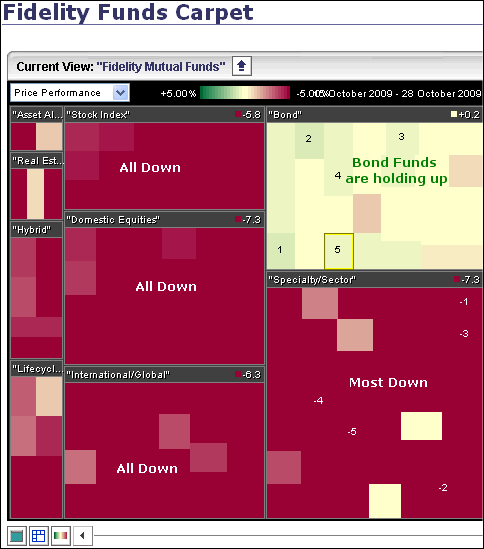
Even if you do not trade Fidelity Funds, the Fidelity Funds Carpet can be useful for providing an overview of market action. All stock index funds, domestic equity funds and international funds are down over the last 10 days (lots of red)... Read More
Don't Ignore This Chart! October 28, 2009 at 02:14 PM
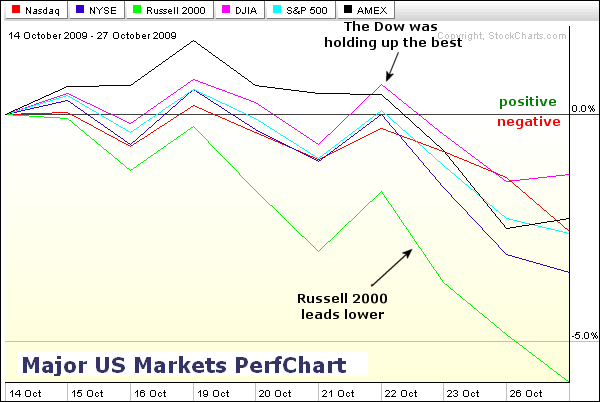
The Major US Markets Perfchart shows the Russell 2000 ($RUT) leading the way lower over the last two weeks. Notice that the Russell 2000 has not even been positive (above 0%) over the last 10 days... Read More
Don't Ignore This Chart! October 27, 2009 at 01:43 PM
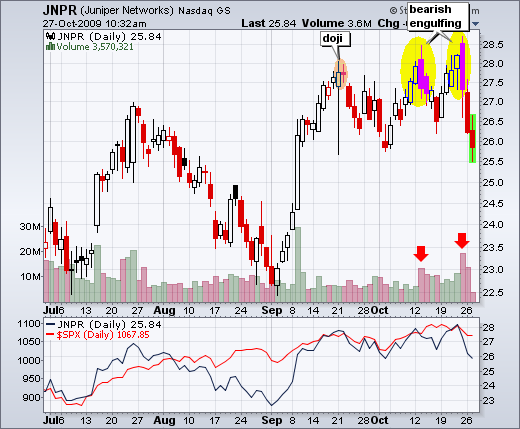
Two big bearish engulfing patterns solidify resistance around 28-28.5 for Juniper Networks (JNPR). JNPR first established resistance at 28 with a doji. A few weeks later, the stock opened strong and closed weak to form its first high-volume bearish engulfing... Read More
Don't Ignore This Chart! October 26, 2009 at 01:38 PM
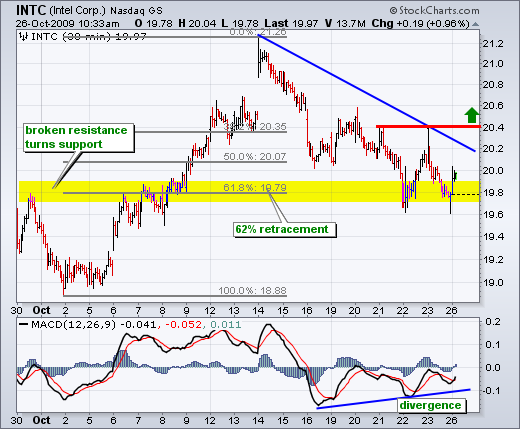
After a decline the last eight days, Intel (INTC) is showing signs of firmness near a support zone. First, notice that the decline retraced 62% of the prior advance. Second, notice that broken resistance turns into support... Read More
Don't Ignore This Chart! October 23, 2009 at 01:23 PM
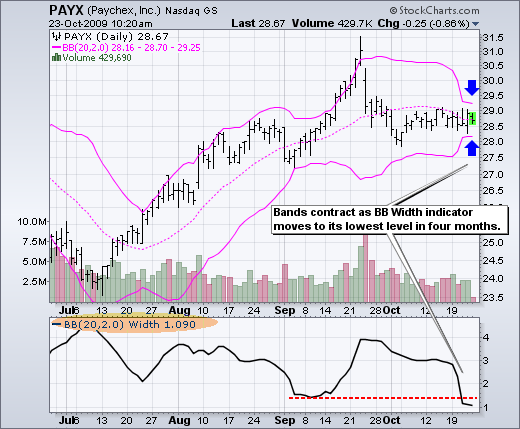
The Bollinger Bands are contracting as Paychex (PAYX) trades within a narrow range this month. First, you can see the bands narrowing significantly this week (blue arrows). Second, the Bollinger Band Width indicator is trading at its lowest level in over four months... Read More
Don't Ignore This Chart! October 22, 2009 at 12:43 PM
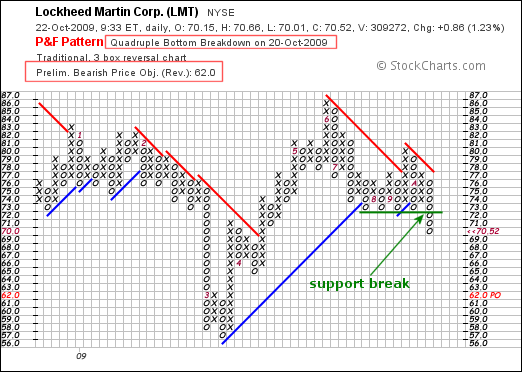
Looking across the P&F scan page on Thursday, I came across Lockheed Martin (LMT) with a quadruple bottom breakdown. Actually, this is a quintuple bottom break down. After four bounces off support, LMT broke through on the fifth try... Read More
Don't Ignore This Chart! October 21, 2009 at 12:28 PM
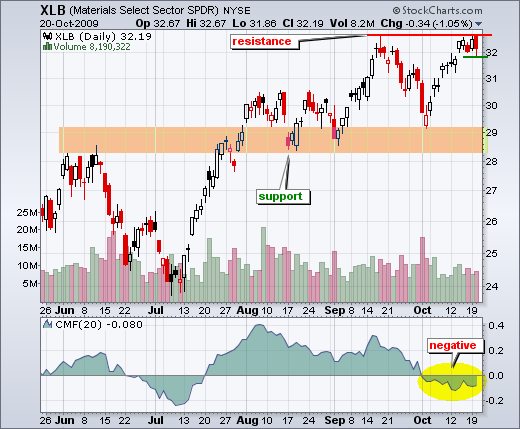
Even though the Materials SPDR (XLB) is challenging resistance from the September highs, Chaikin Money Flow remains in negative territory. In fact, CMF has been negative throughout October. This shows underlying weakness in the current advance... Read More
Don't Ignore This Chart! October 20, 2009 at 01:45 PM
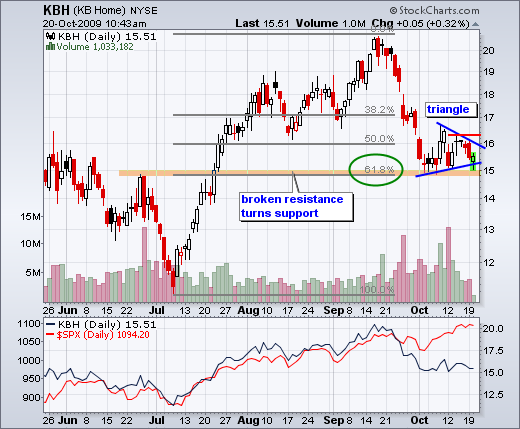
A number of chart features are coming together to mark support around 15 for KB Home (KBH). First, the decline retraced 62% of the prior advance. Second, broken resistance turns into support. Third, the stock firmed the last three weeks... Read More
Don't Ignore This Chart! October 19, 2009 at 12:31 PM
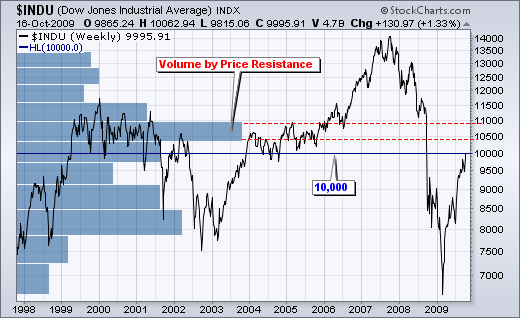
Much has been make about Dow 10,000 this week, but technicians may want to focus about 500 points higher instead. The chart below shows Volume-by-Price for the Dow Industrials. Notice that the longest bar is around 10500-11000... Read More
Don't Ignore This Chart! October 16, 2009 at 12:40 PM
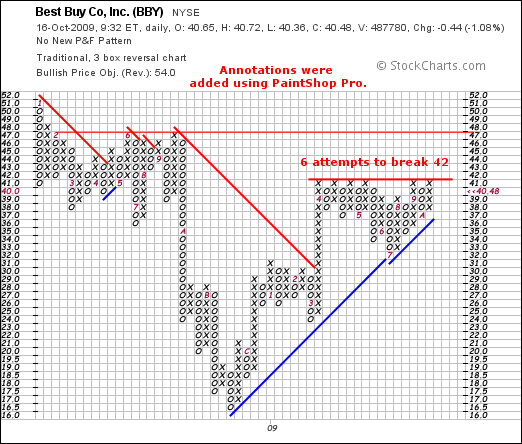
Point&Figure charts are great for showing support and resistance. Best Buy (BBY) hit a ceiling at 42 over the last five months. A breakout above resistance (another "X") would trigger a bullish signal and target further strength towards the next resistance level at 48... Read More
Don't Ignore This Chart! October 15, 2009 at 12:26 PM
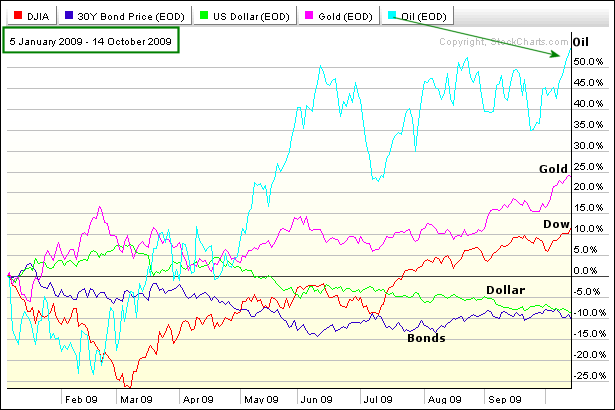
With the Dow hitting 10,000 on Wednesday, it is a good time to check the intermarket PerfChart for 2009. West Texas Intermediate ($WTIC) is by far the biggest winner this year with a gain around 55%. Gold-Continuous Futures ($GOLD) is up around 24% and the Dow is up 11.87%... Read More
Don't Ignore This Chart! October 14, 2009 at 02:02 PM
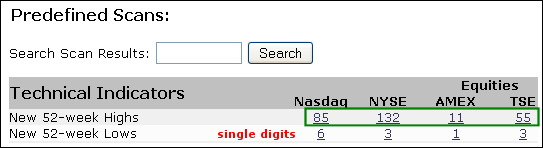
The top of the predefined scan page says it all. New 52-week highs are outpacing new 52-week lows, by a wide margin. In fact, new 52-week lows are in the single digits for all four exchanges shown on the table. No sign of weakness here... Read More
Don't Ignore This Chart! October 13, 2009 at 08:42 PM
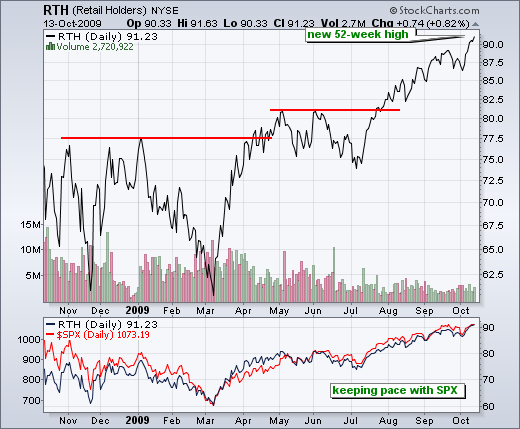
The Retail HOLDRS (RTH) continues its up trend with another 52-week high on Tuesday. The chart below shows prices over the last 12 months and Tuesday's close in the highest. In the indicator window, notice that RTH is keeping pace with the S&P 500 (red line)... Read More
Don't Ignore This Chart! October 12, 2009 at 05:33 PM
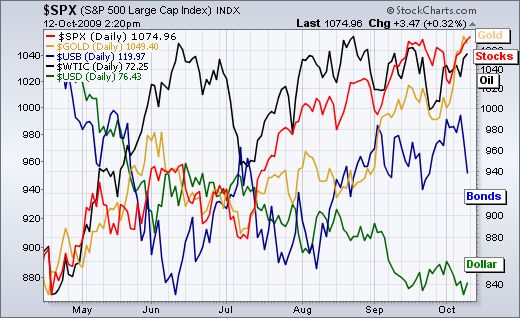
The intermarket chart below shows bonds (blue line) taking a hit last week. The 30-year Treasury Bond ($USB) fell back toward support from its September lows. Weakness in bonds is understandable with West Texas Intermediate ($WTIC) challenging its summer highs... Read More
Don't Ignore This Chart! October 09, 2009 at 01:47 PM
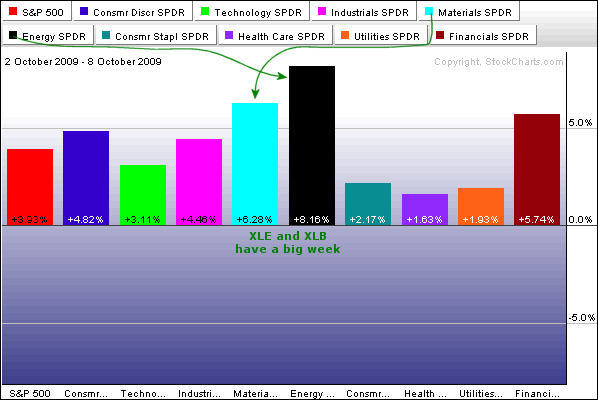
The Energy SPDR (XLE) and the Materials SPDR (XLB) started October with a bang. Over the last five days, XLE is up over 8% and XLB is up over 6%. The Financials SPDR (XLF) comes in a close second with a 5.74% gain. All three easily outperformed the S&P 500... Read More
Don't Ignore This Chart! October 08, 2009 at 12:59 PM
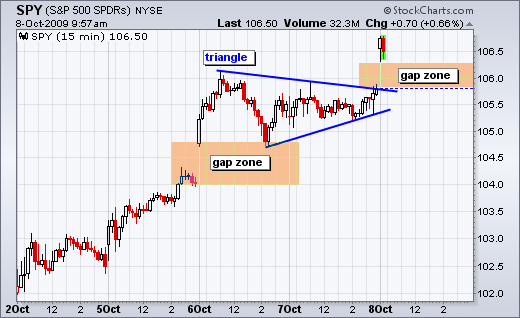
SPY is at it again with its second gap this week. The ETF gapped higher on Tuesday and held the gap zone. After a triangle consolidation, SPY gapped above 106 this morning to create another gap zone that marks first support... Read More
Don't Ignore This Chart! October 07, 2009 at 02:16 PM
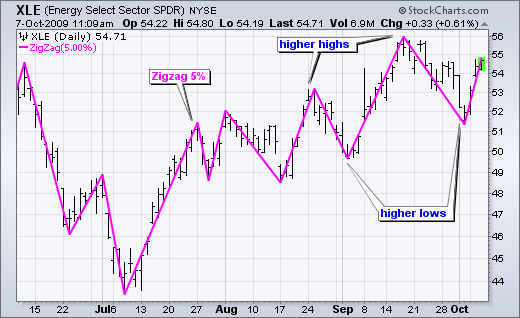
The chart below shows the Energy SPDR (XLE) with a 5% Zigzag. This indicator filters out smaller fluctuations by only identifying moves of at least 5%. XLE is currently zigzagging up with higher highs and higher lows. A break below the October low would reverse this uptrend... Read More
Don't Ignore This Chart! October 06, 2009 at 01:31 PM
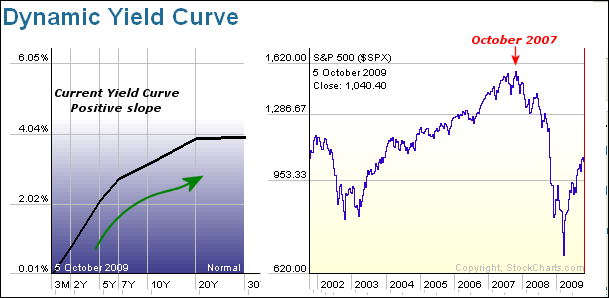
With short-term rates near zero and long-term rates around 4%, the yield curve is clearly positive. This sharply positive slope reflects loose monetary policy at the Fed that is designed to stimulate the economy... Read More
Don't Ignore This Chart! October 05, 2009 at 09:09 PM
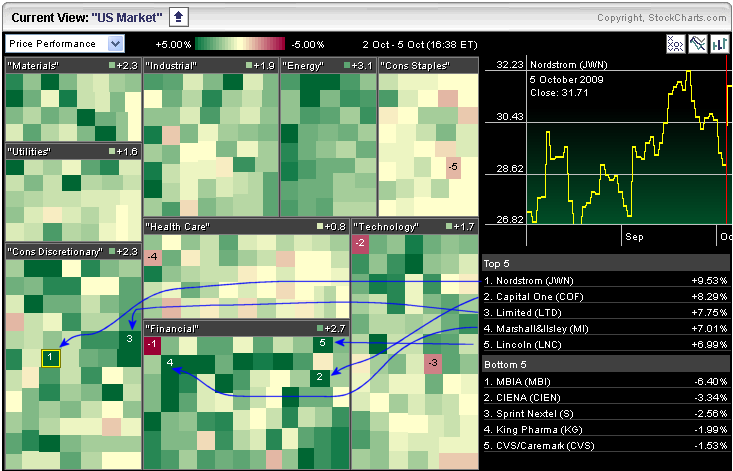
The Financial sector lit up the Market Carpet on Monday with the most green. Three of the top five gainers came from the Financial sector. The consumer discretionary sector was second with two of the top five gainers on Monday... Read More
Don't Ignore This Chart! October 02, 2009 at 12:58 PM
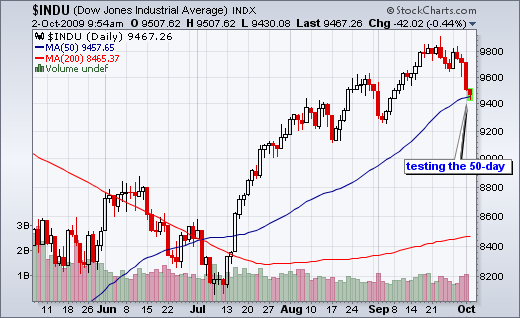
With a sharp decline the last seven days, the Dow Industrials is testing is 50-day moving average, which is currently at 9457. This is the first test of the moving average since the Dow surged in mid July... Read More
Don't Ignore This Chart! October 01, 2009 at 01:49 PM
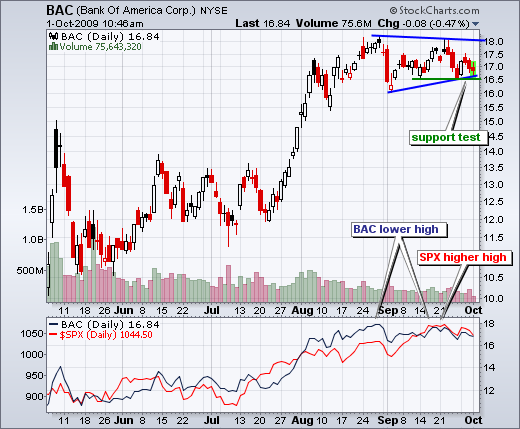
Bank of America (BAC) is testing support around 16.5 as the stock starts showing relative weakness. Support around 16.5 stems from the mid September lows and triangle trendline... Read More