Don't Ignore This Chart! February 26, 2010 at 03:02 PM
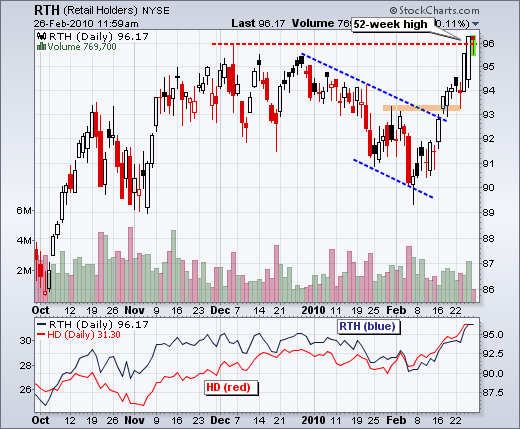
The Retail HOLDRS (RTH) recorded a 52-week high with help from Home Depot (HD). RTH broke above channel resistance in mid February and above its December highs this week. The indicator window shows both RTH and HD. Notice how HD also moved above its December high... Read More
Don't Ignore This Chart! February 25, 2010 at 02:53 PM
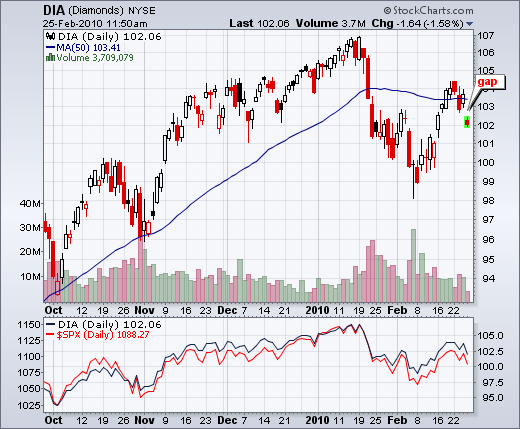
After battling its 50-day moving average the prior five days, the Dow Diamonds (DIA) gapped down in early trading on Thursday. This gap reinforces resistance around the 50-day and is considered short-term bearish as long as it remains unfilled... Read More
Don't Ignore This Chart! February 24, 2010 at 06:32 PM
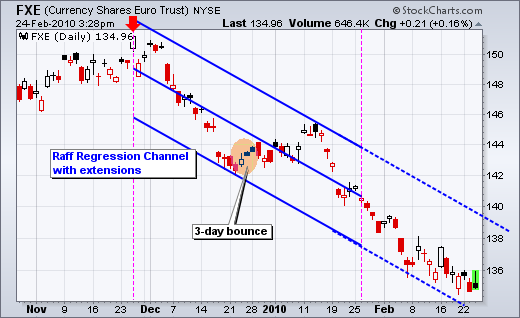
Since peaking in late November, bounces in the Euro ETF (FXE) have been limited to three days. In fact, except for one 3-day bounce in late December, bounces have actually been 1-2 days. The Raff Regression Channel with extensions defines the current downtrend... Read More
Don't Ignore This Chart! February 23, 2010 at 05:35 PM
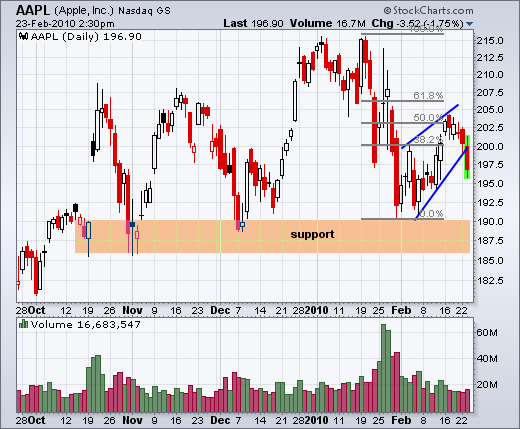
Apple (AAPL) met resistance at a key retracement zone last week and broke below the wedge trendline with a sharp decline today. Notice that Apple was turned back in the 50-62% retracement zone. With the wedge break, the next target is the support zone around 187.50... Read More
Don't Ignore This Chart! February 22, 2010 at 02:34 PM
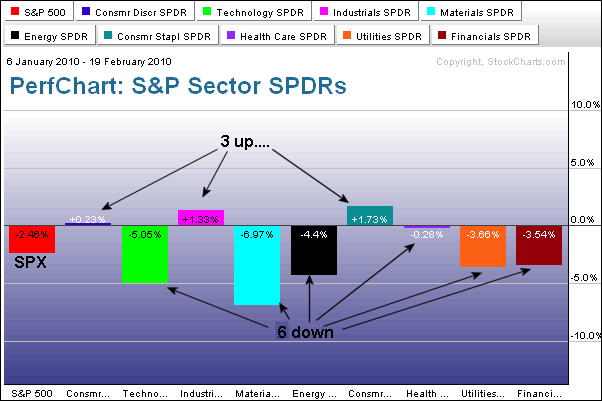
The sector SPDR perchart reflects a mix market (at best) for 2010. The S&P 500 is down around 2.46% since January 6th. Of the nine sectors, only three are up (consumer discretionary, industrials and consumer staples... Read More
Don't Ignore This Chart! February 19, 2010 at 07:42 AM
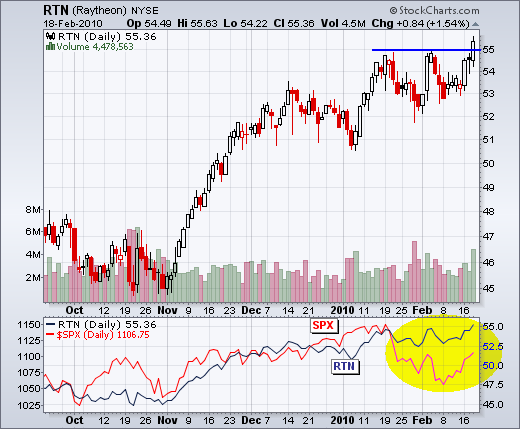
Raytheon (RTN) shows relative strength with a break above the January high. The S&P 500 and RTN are shown in the indicator window. Notice that RTN is trading above its January high, but the S&P 500 remains well below its January high. Defense is attracting money... Read More
Don't Ignore This Chart! February 18, 2010 at 08:25 AM
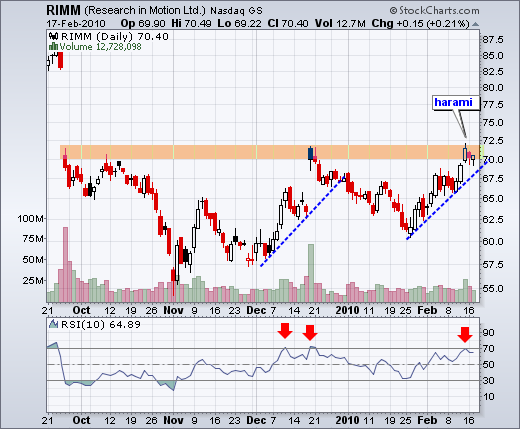
With an advance back to the low 70s, RIMM is one again trading near resistance. The stock was turned back here in mid October and mid December. Also notice that a harami formed on Friday-Tuesday and RSI become overbought last Friday... Read More
Don't Ignore This Chart! February 17, 2010 at 12:34 PM
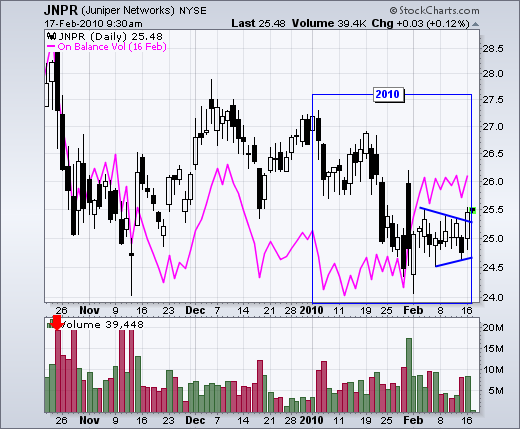
Juniper (JNPR) is down for the year, but On Balance Volume (OBV) is up so far in 2010. Joe Granville, creator of OBV, postulated that volume precedes price. This simple indicator broke resistance with a surge in early February... Read More
Don't Ignore This Chart! February 16, 2010 at 06:34 PM
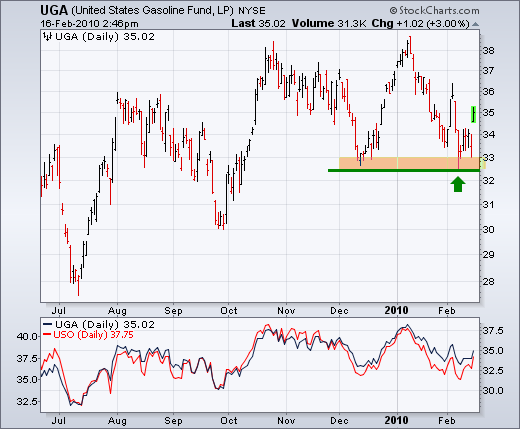
The US Gasoline ETF (UGA) surged off support with a gap and big move on Tuesday. This successful support test keeps the overall uptrend in place. A break below the Dec-Feb lows would reverse the medium-term uptrend. Notice how closely UGA and USO track... Read More
Don't Ignore This Chart! February 12, 2010 at 08:07 AM
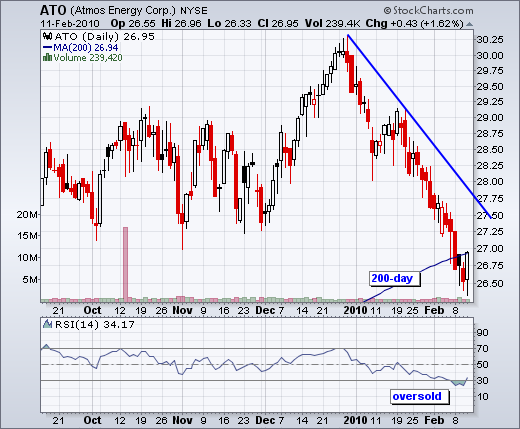
Atmos Energy came across the oversold RSI scan as 14-day RSI moved above 30 on Thursday. Also notice that the stock bounced right back to its 200-day moving average... Read More
Don't Ignore This Chart! February 11, 2010 at 07:51 AM
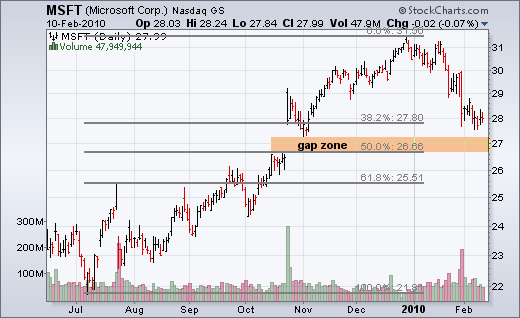
After a sharp (~10%) decline this year, Microsoft (MSFT) is nearing its first support zone around 27-28. Support here stems from the October gap and the 38% retracement. MSFT firmed around 28 over last four days and yesterday's range was the narrowest of the last six days... Read More
Don't Ignore This Chart! February 10, 2010 at 07:47 AM
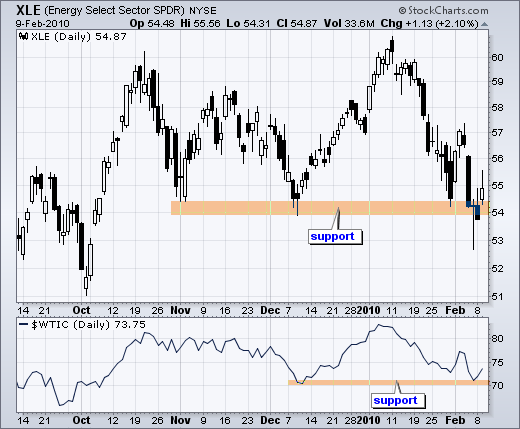
The Energy SPDR (XLE) and West Texas Intermediate ($WTIC) are both testing support from their December lows. XLE bounced off the 54 area in early November and early December to establish support. Oil bounced off 70 in early December to establish support... Read More
Don't Ignore This Chart! February 09, 2010 at 07:36 AM
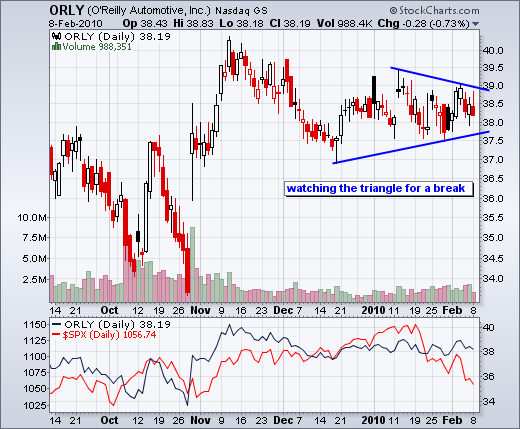
After a decline from mid November to mid December, O'Reilly Automotive (ORLY) formed a triangle consolidation. The stock is holding up better that the S&P 500 since January, but a triangle break is required for the next directional signal... Read More
Don't Ignore This Chart! February 08, 2010 at 07:23 PM
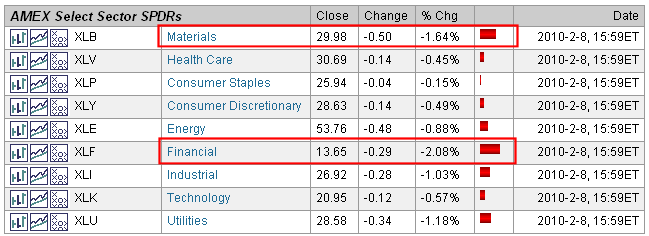
The Sector SPDR section of the Market Summary shows the Financials SPDR (XLF) and the Materials SPDR (XLB) leading the market lower today. Despite Friday's intraday reversal, there was no follow through as all sectors moved lower on Monday... Read More
Don't Ignore This Chart! February 05, 2010 at 07:15 AM
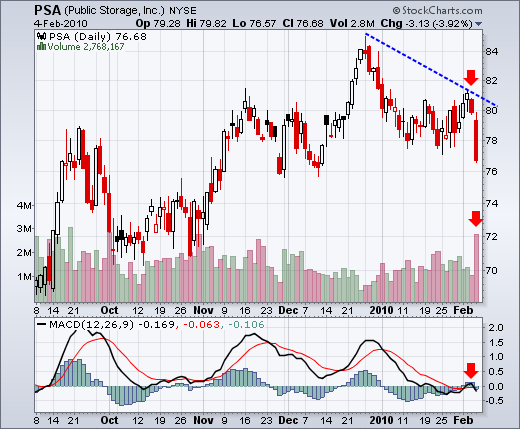
Public Storage (PSA) came across the Bearish MACD Crossover on the predefined scans page. The chart below shows PSA gapping down and closing weak with high volume. MACD moved from positive territory to negative territory as it crossed back below its signal line... Read More
Don't Ignore This Chart! February 04, 2010 at 06:55 AM
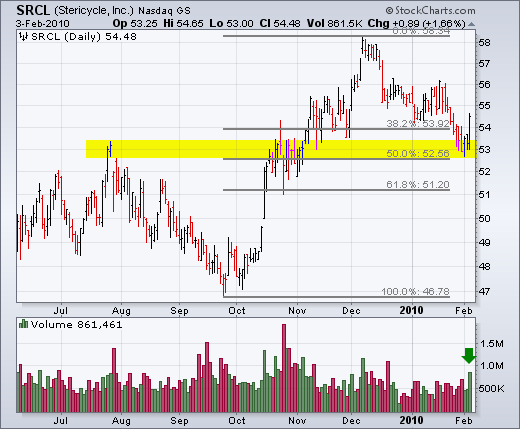
Stericycle (SRCL) broke resistance with a surge last year and returned to broken resistance this year. It looks like broken resistance is turning into support as the stock surged with good volume on Wednesday... Read More
Don't Ignore This Chart! February 03, 2010 at 08:37 AM
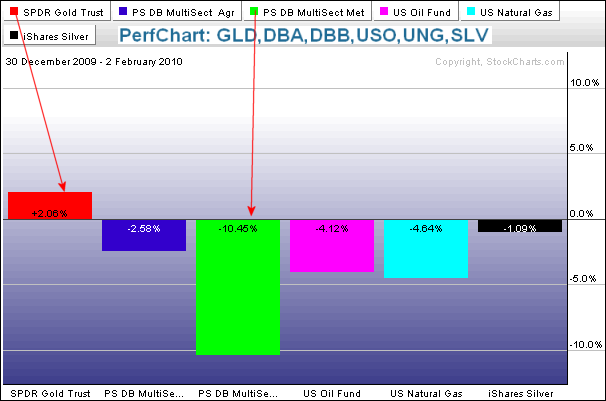
2010 has not been a good year for commodity ETFs so far. The PerfChart below shows six commodity ETFs from December 30th to February 2nd. Five of the six are down with the The DB Base Metals ETF (DBB) down over 10%. The Gold ETF (GLD) is the only gainer... Read More
Don't Ignore This Chart! February 02, 2010 at 07:24 AM
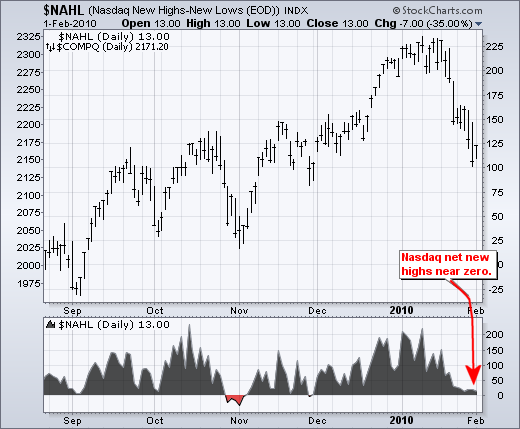
With the decline over the last few weeks, Net New Highs on the Nasdaq moved below +50. This indicator was above +200 in early January and is now flirting with negative territory. Net New Highs equals new 52-week highs less new 52-week lows... Read More
Don't Ignore This Chart! February 01, 2010 at 06:33 PM
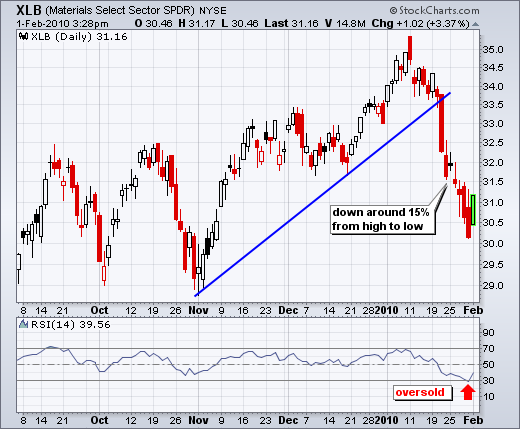
The harder they fall, the bigger they bounce. The Materials SPDR (XLB) led the sectors lower by declining around 15% from high to low the prior three weeks. In the process, the ETF was down 11 of the last 15 days... Read More