Don't Ignore This Chart! April 29, 2011 at 02:44 PM
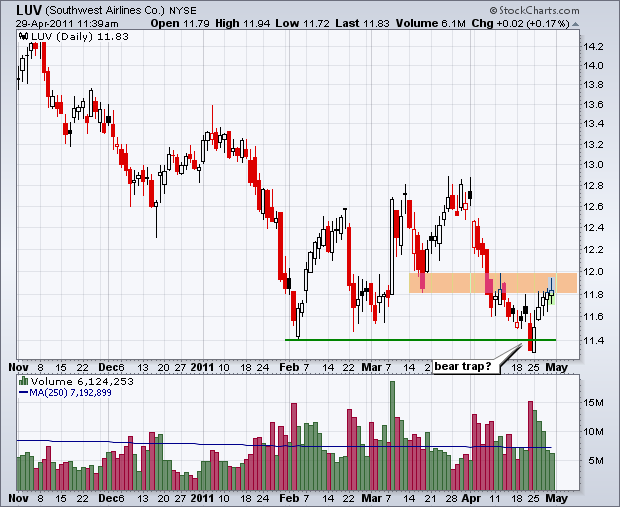
Southwest Airlines (LUV) broke support with high volume in late April, but quickly recovered this support break with a surge back above 11.60 the last few days. Despite this quick recovery, signs of indecision are showing with the upper shadows in the candlesticks... Read More
Don't Ignore This Chart! April 28, 2011 at 01:21 PM
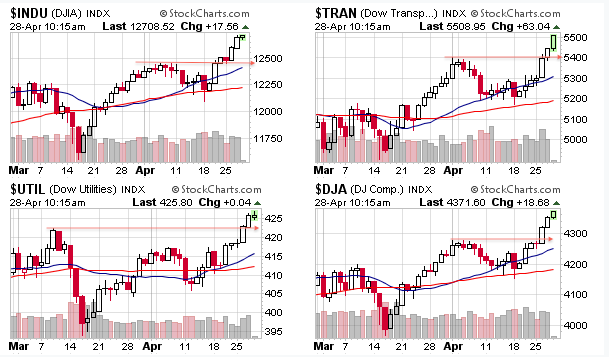
The Dow Industrials, Dow Transports, Dow Utilities and Dow Composite all broke above their March-April highs and recorded 52-week highs this week... Read More
Don't Ignore This Chart! April 27, 2011 at 07:04 PM
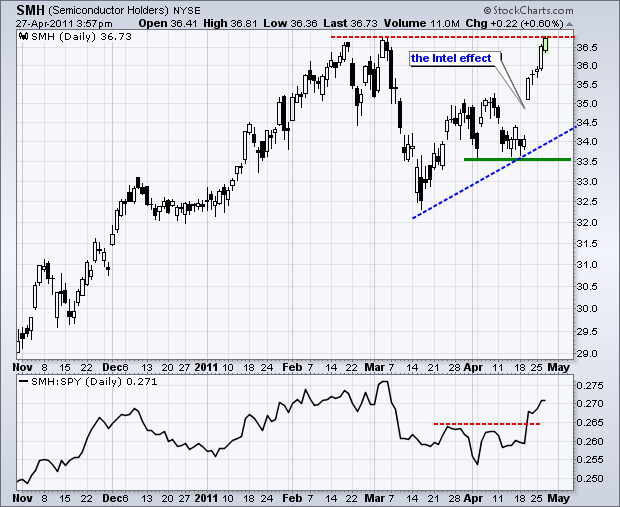
It all started with the Intel earnings effect five days ago as the Semiconductor HOLDRS (SMH) gapped above 35. After stalling for two days, the ETF continued hiher and is now challenging the February-March highs... Read More
Don't Ignore This Chart! April 26, 2011 at 07:06 PM
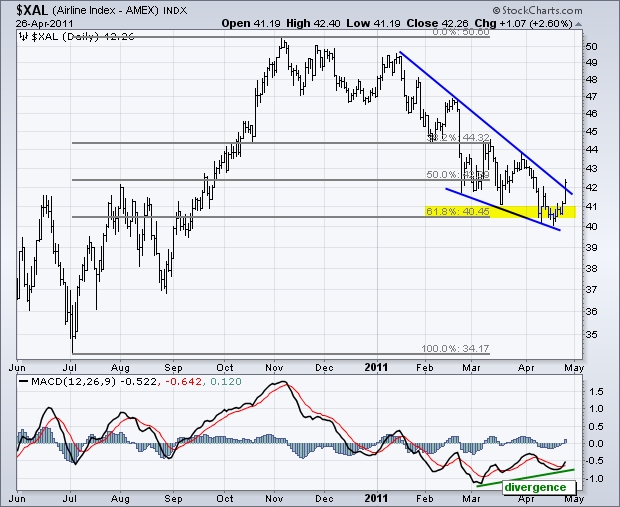
Is this bounce for real or just another dead-cat bounce? The Amex Airline Index ($XAL) hit the 62% retracement area in mid April and surged above the wedge trendline on Tuesday. Also notice that MACD formed a bullish divergence and moved above its signal line... Read More
Don't Ignore This Chart! April 25, 2011 at 04:23 PM
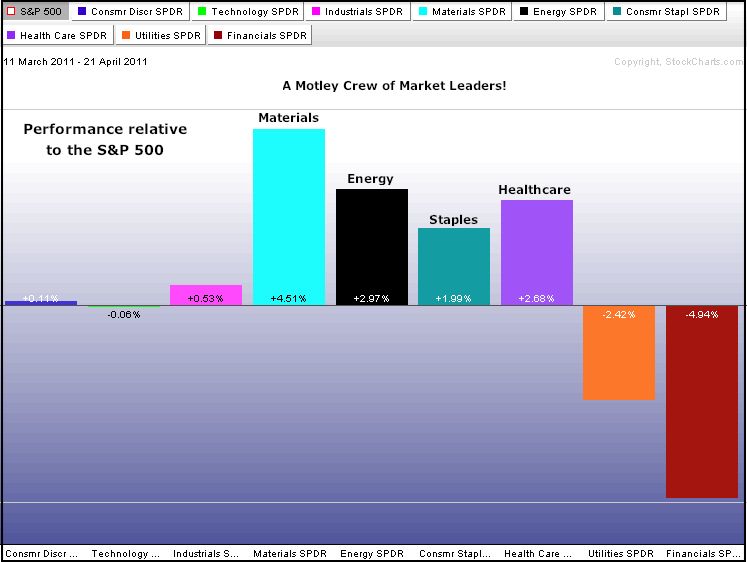
Even though stocks are up over the last 30 trading days, sector leadership leaves something to be desired. The Finance is badly lagging, while the materials and energy sectors are leading. Also notice that the healthcare and consumer staples show relative strength... Read More
Don't Ignore This Chart! April 21, 2011 at 01:20 PM
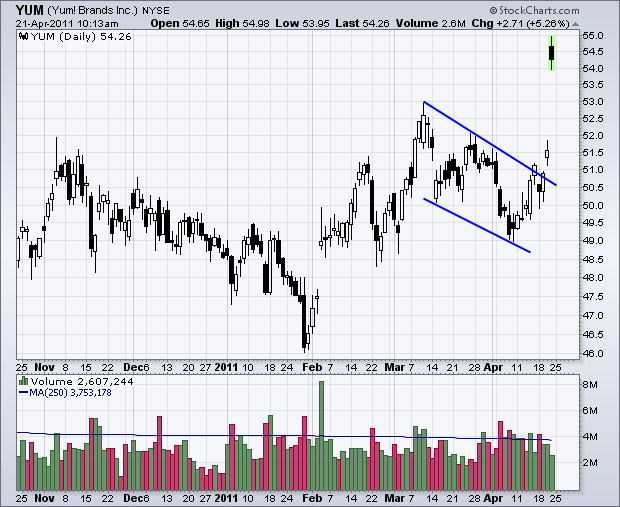
The predefined scans page at StockCharts.com is updated throughout the day. Checking just after the open is an easy way to spot early movers, both up and down. The runaway gap-up scan featured over 5 NYSE stocks and 16 Nasdaq stocks at 10:14AM ET... Read More
Don't Ignore This Chart! April 20, 2011 at 08:26 PM
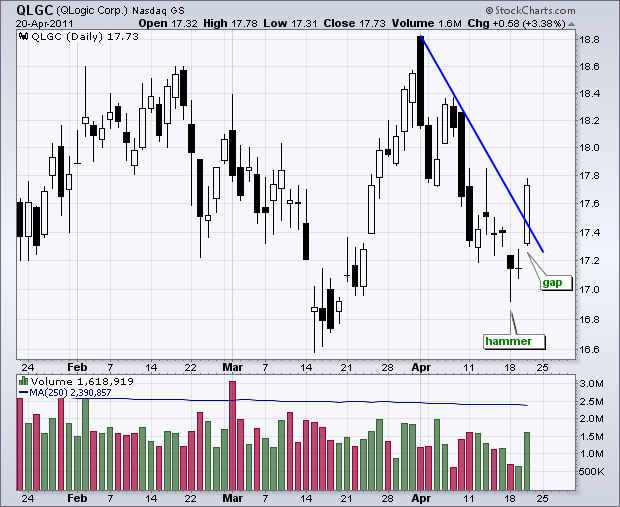
The hammer and gap play is everywhere this week. It started with an intraday recovery on Monday and continued with a gap-surge on Wednesday. QLGC formed such a combo over the last three days and broke above the early April trendline... Read More
Don't Ignore This Chart! April 19, 2011 at 07:40 PM
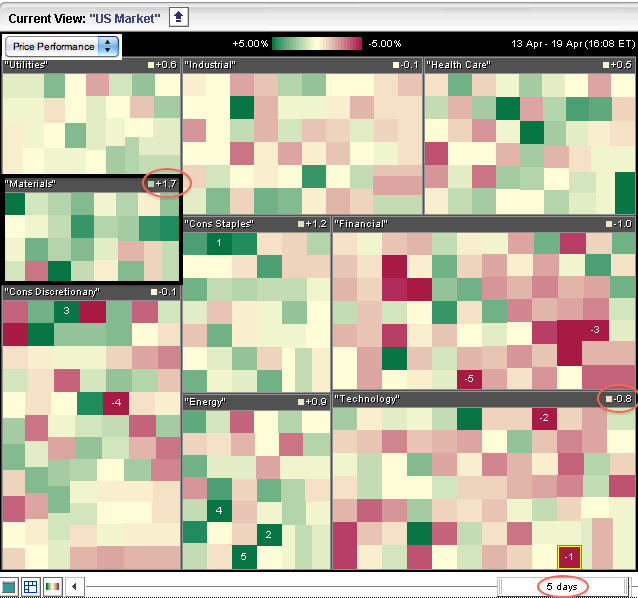
The S&P Sector Market Carpet provides a colorful snapshot of sector performance over a given timeframe. The screen grab below shows a 5-day Price Performance Market Carpet. Stocks in the materials sector are up an average of 1.7% the last five days (leading)... Read More
Don't Ignore This Chart! April 18, 2011 at 09:02 PM
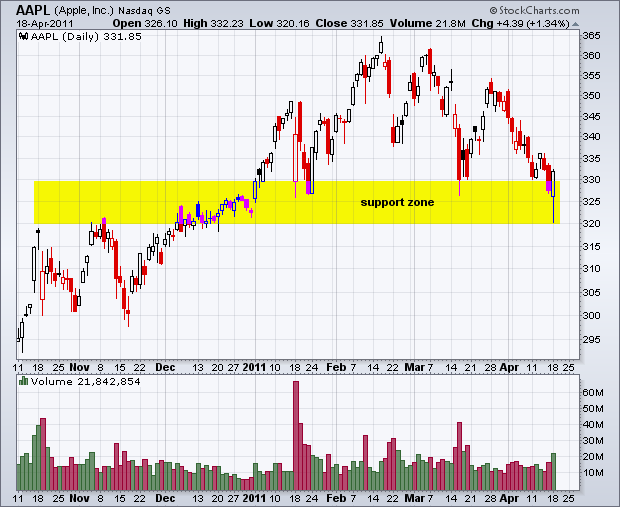
Apple (AAPL) declined into its support zone with a close below 330 on Friday. After a weak open and further weakness early Monday, the stock moved higher and closed strong to firm a piercing line. This bullish candlestick reversal is featured on the predefined scans page... Read More
Don't Ignore This Chart! April 15, 2011 at 02:33 PM
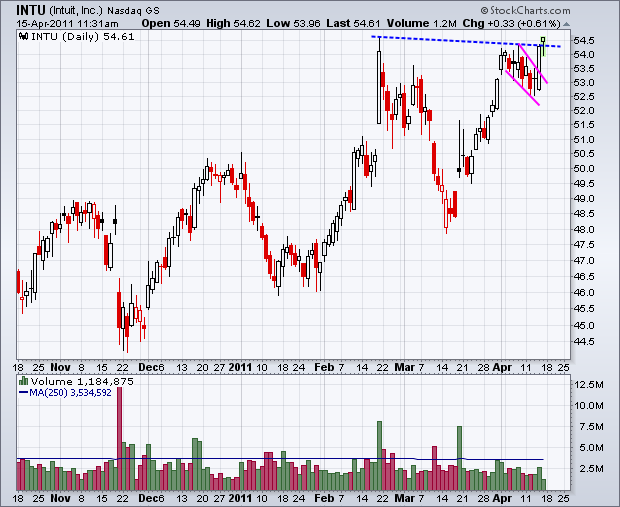
Intuit (INTU), the maker of Turbo Tax Software, appears to like tax day. The stock broke above wedge resistance with a long white candlestick on Thursday and hit a 52-week high on Friday, April 15th... Read More
Don't Ignore This Chart! April 14, 2011 at 06:50 PM
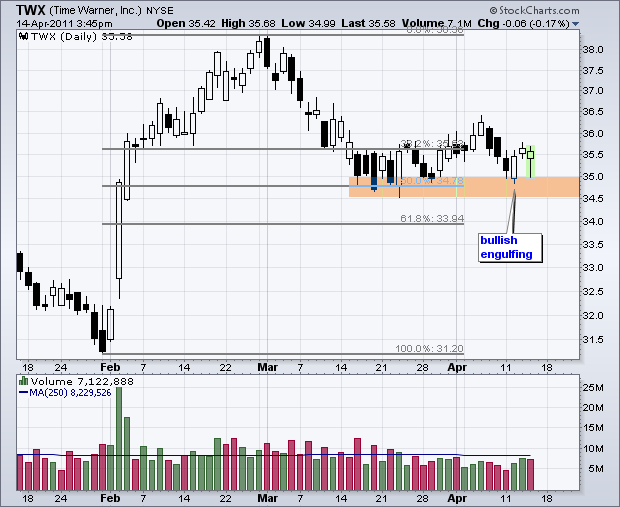
After hitting the bullish engulfing scan on Tuesday, Time Warner is set to appear on the hammer scan for Thursday. The stock surged in February and then retraced around 50% with a decline to the 35 area... Read More
Don't Ignore This Chart! April 13, 2011 at 07:31 PM
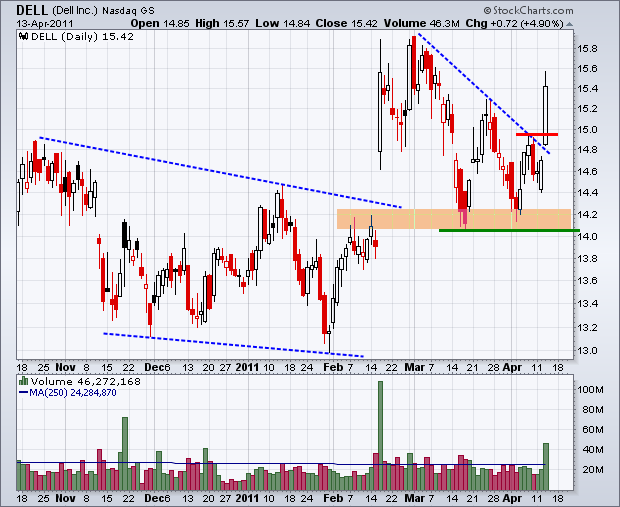
For the second time in three months, Dell Inc (DELL) surged above 15 with big volume. The stock pulled back to broken resistance and bounced off support twice in mid March and early April. Today's big surge solidifies support and suggests that DELL has begun a bigger uptrend... Read More
Don't Ignore This Chart! April 12, 2011 at 02:22 PM
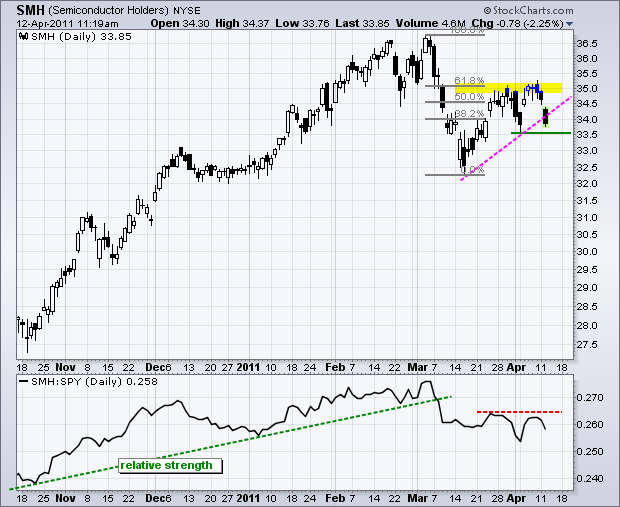
The Semiconductor HOLDRS surged at the beginning of last week, but hit resistance from the same retracement and plunged this week. The 62% retracement marked resistance in late March and again in early April... Read More
Don't Ignore This Chart! April 11, 2011 at 08:42 PM
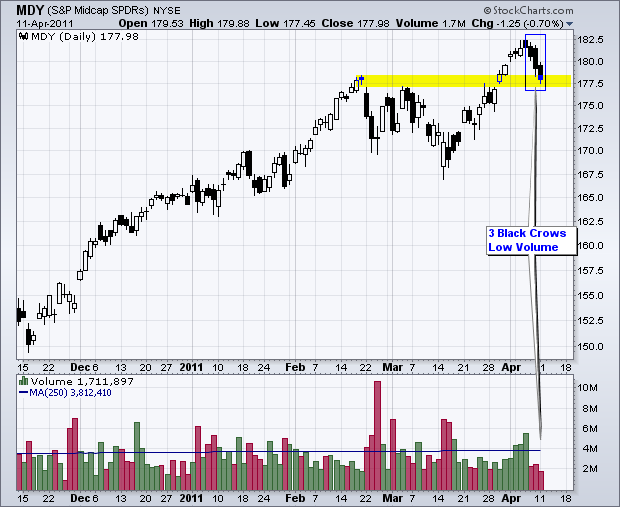
Three Black Crows is a bearish candlestick reversal pattern with three black filled candlesticks. A candlestick is filled when the close is below the open. Despite this bearish pattern, volume remains relatively low and support from broken resistance is at hand... Read More
Don't Ignore This Chart! April 08, 2011 at 02:58 PM
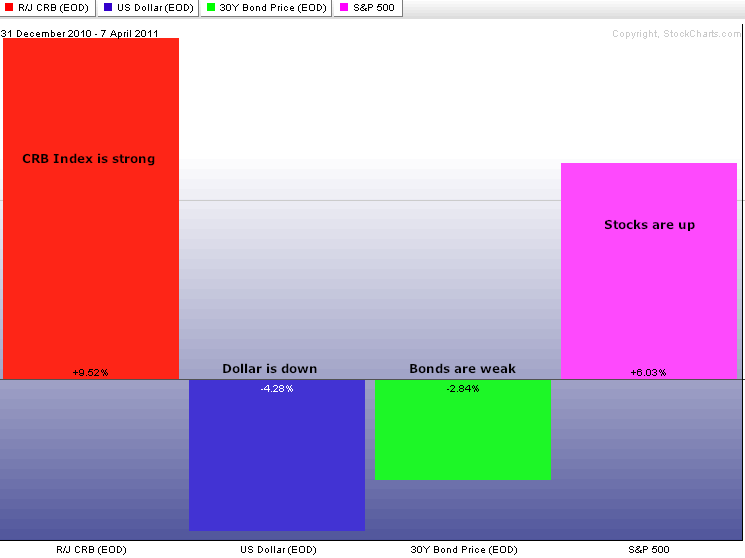
Some key intermarket relationships remain alive and well in 2011. First, commodities have been moving higher as the Dollar weakens. Second, bonds have been moving lower as commodities advance... Read More
Don't Ignore This Chart! April 07, 2011 at 05:37 PM
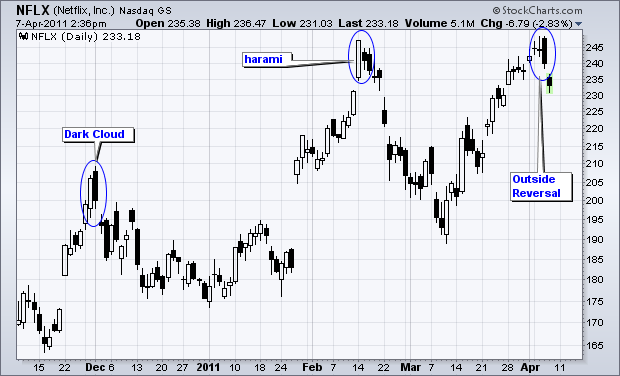
Bearish candlestick patterns marked the prior two reaction highs in Netflix and the stock formed an outside reversal on Wednesday. Strictly speaking, this is not bearish engulfing because Tuesday's candlestick is actually black... Read More
Don't Ignore This Chart! April 06, 2011 at 08:55 PM
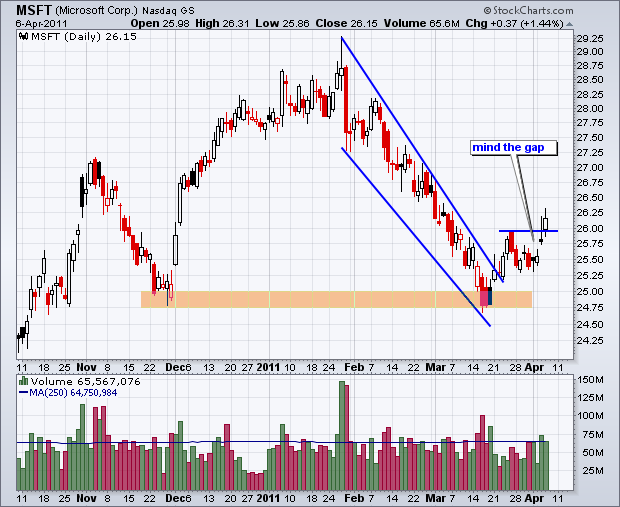
After a dismal February and early March, Microsoft is making up for some lost ground with a surge over the last three weeks. The stock gapped up on Tuesday with above average volume and followed through above its late March high with a good gain on Wednesday... Read More
Don't Ignore This Chart! April 05, 2011 at 07:09 PM
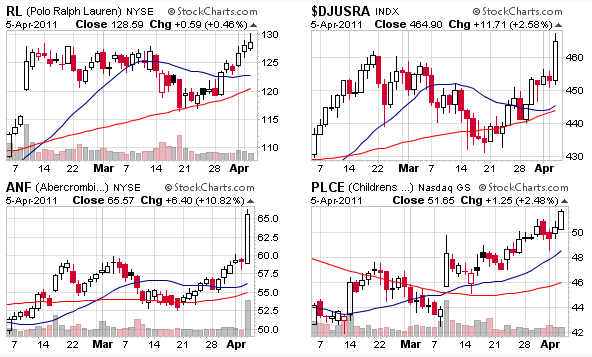
The Retail SPDR (XRT) surged to another 52-week high today with strength coming from the retail apparel group. Candleglance chart groups for over 50 industries can be found at the top of the third column on the FreeCharts page... Read More
Don't Ignore This Chart! April 04, 2011 at 08:06 PM
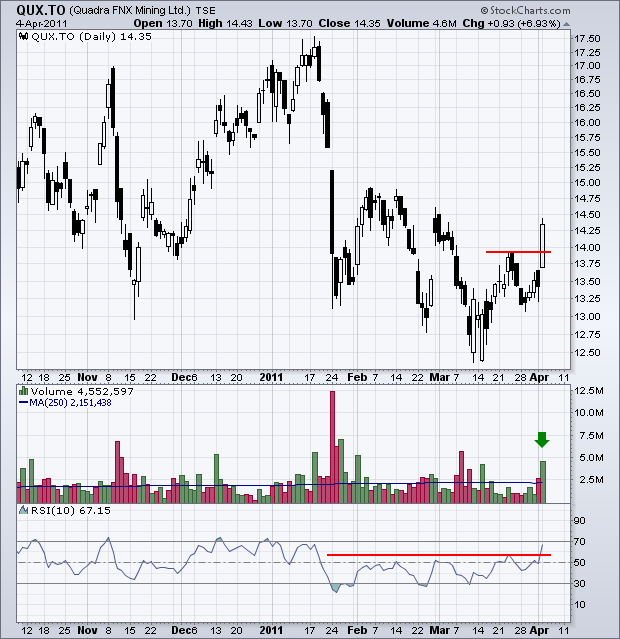
After a rough start at the beginning of the year, Quadra Mining (QUX.TO) may be finding its feet with a high volume breakout. The stock surged to a 4-week high on the highest volume in four weeks... Read More
Don't Ignore This Chart! April 01, 2011 at 03:04 PM
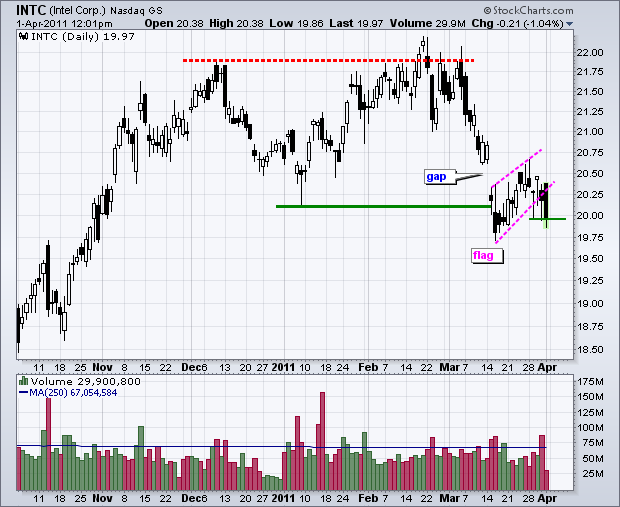
Despite a rather broad market rally early Friday, Intel ($INTC) was under pressure with a sharp decline that broke flag support. The mid March gap proved too tough and this flag break signals a continuation lower... Read More