Don't Ignore This Chart! April 30, 2013 at 07:44 PM
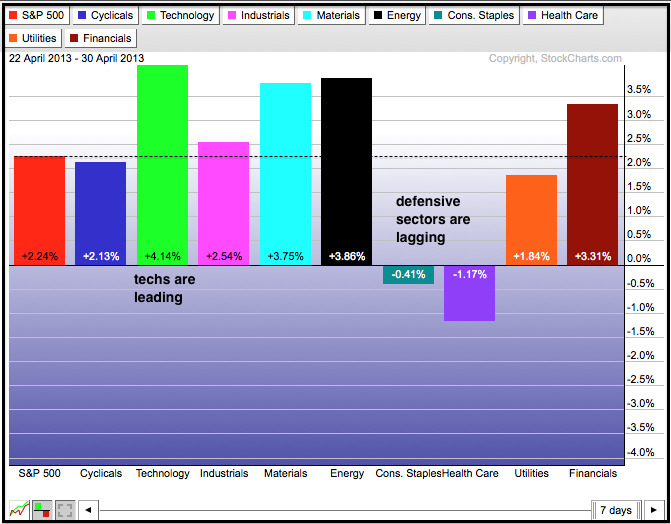
After months of leadership from the three defensive sectors, the tables turned over the last seven days as the Technology SPDR (XLK) started leading the market... Read More
Don't Ignore This Chart! April 29, 2013 at 09:52 AM
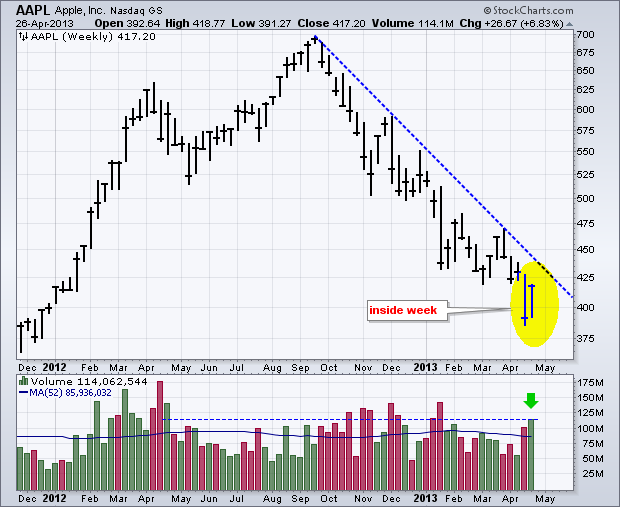
Apple (AAPL) remains in a downtrend overall, but signs of firmness emerged as the stock forged an inside week. This occurs when the week's high-low range is inside the prior week's high-low range. Also notice that the stock advanced on the highest upside volume since April 2012... Read More
Don't Ignore This Chart! April 26, 2013 at 03:54 PM
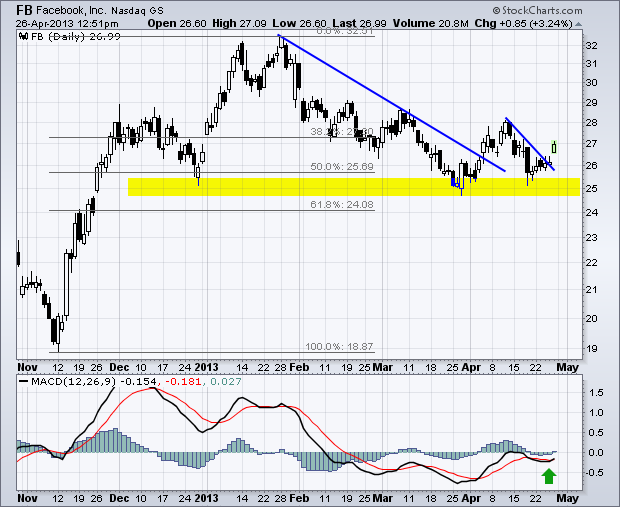
Facebook (FB) has underperformed the market this year, but momentum is improving as MACD moved above its signal line this week. Notice how the stock held support in the 25 area and gapped up on Friday. This gap is bullish as long as it holds. A move below 25... Read More
Don't Ignore This Chart! April 25, 2013 at 02:35 PM
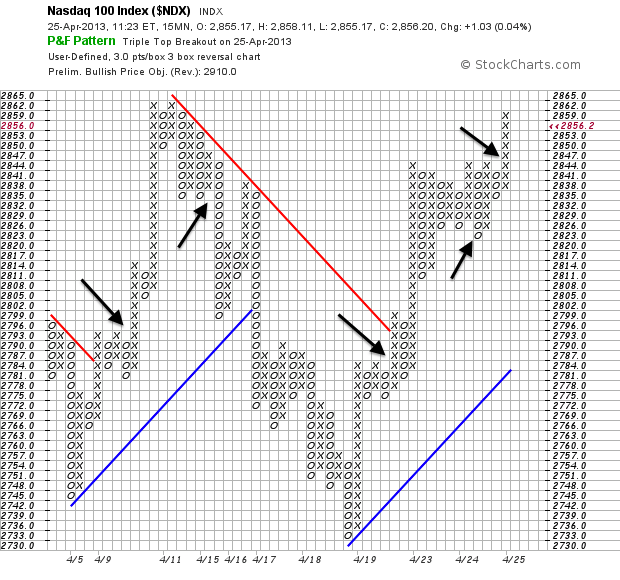
The Nasdaq 100 ($NDX) swings have been quite wild this month, but the 15 minute P&F chart captured these pretty well. In particular, the Triple Top Breakout and Triple Bottom Breakdown identified the early April upswing, the mid April downswing and the upswing over the past week... Read More
Don't Ignore This Chart! April 24, 2013 at 09:27 AM
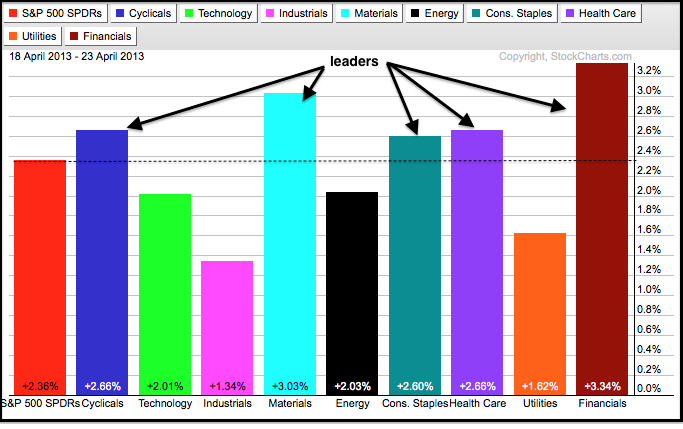
After a sharp decline last week, stocks recovered with bounce the last three days. The Sector PerfChart shows the Consumer Discretionary SPDR (XLY), Finance SPDR (XLF) and Basic Materials SPDR (XLB) leading this bounce... Read More
Don't Ignore This Chart! April 23, 2013 at 06:22 PM
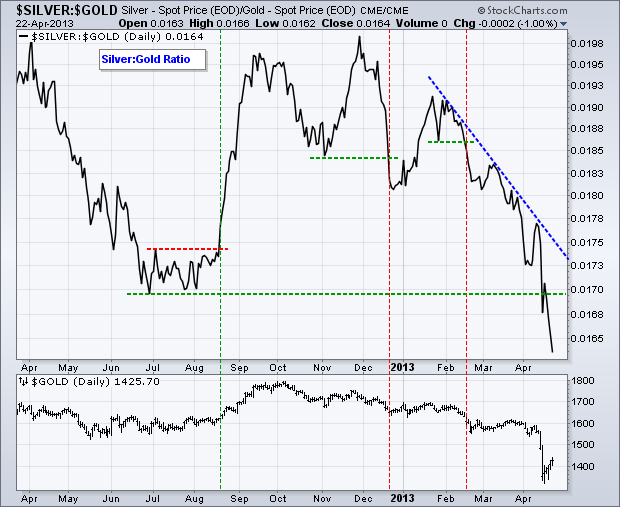
The Silver:Gold Ratio broke down in February and exceeded its summer low in April with a sharp decline. The 52-week low shows that silver is much weaker than gold. This fits with weakness in copper because silver is more of an industrial metal than gold... Read More
Don't Ignore This Chart! April 22, 2013 at 12:43 PM
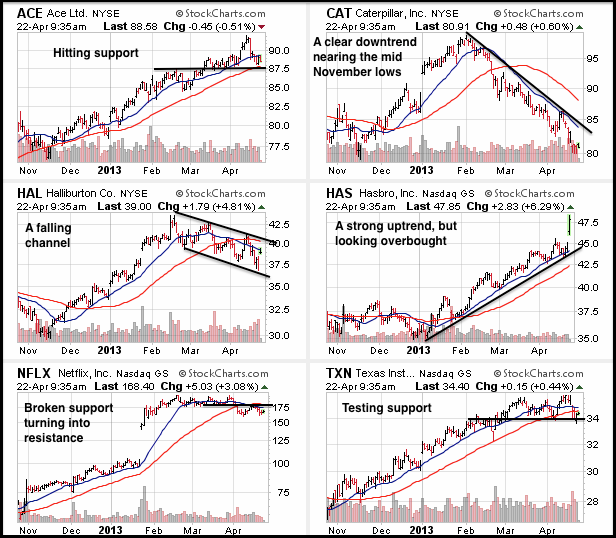
It is a big week for earnings so here are CandleGlance charts for six stocks reporting today. Of interest, ACE is hitting support from broken resistance, CAT is nearing the November low, HAL remains in a falling channel and Texas Instruments is testing support... Read More
Don't Ignore This Chart! April 19, 2013 at 05:04 PM
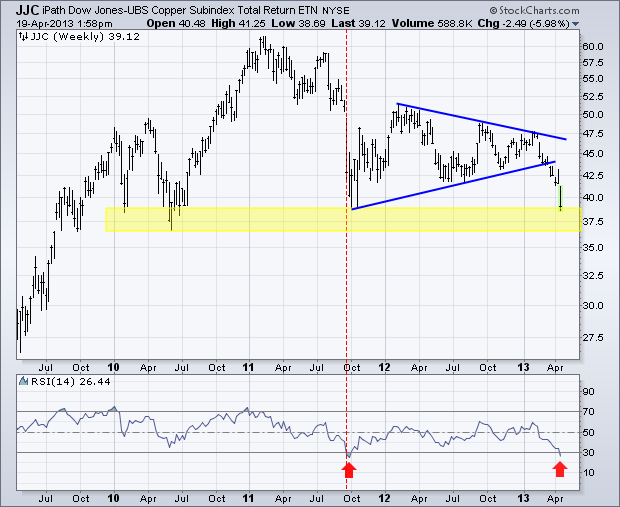
With a sharp decline this month, the Copper ETF (JJC) entered a support zone that extends back to the 2010 lows. The ETF also become oversold as RSI dipped below 30 for the first time since September 2011. The knife, however, is still falling as long as RSI remains below 30... Read More
Don't Ignore This Chart! April 18, 2013 at 10:36 AM
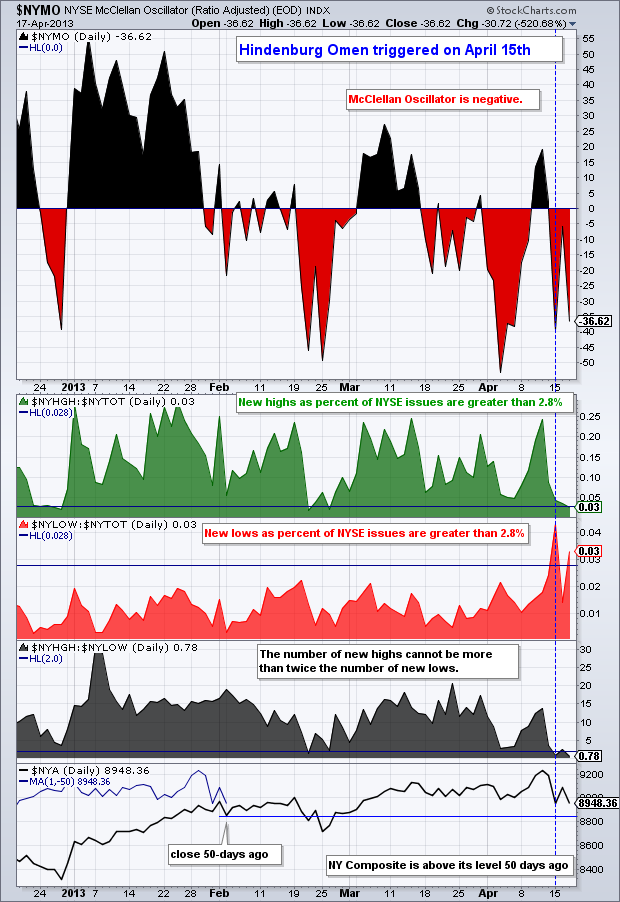
The Hindenburg Omen triggered on Monday as the percentage of new lows and new highs on the NYSE moved above 2.8%. There is some debate on this threshold because I have seen 2.2% and 2.4% used by other analysts. Using these lower thresholds, the omen triggered again on Wednesday... Read More
Don't Ignore This Chart! April 17, 2013 at 07:48 PM
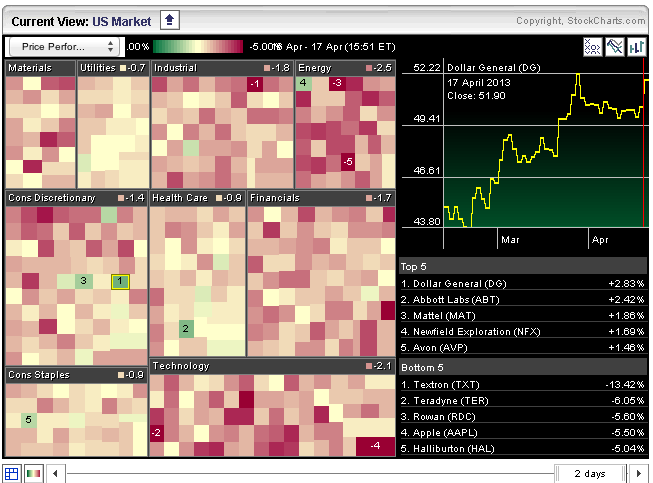
Stocks were hit with across the board selling on Wednesday. All sectors were down, but there were a few stocks that bucked the selling pressure. As the Market Carpet shows, there are at least ten advancing stocks, which are represented by the green or greenish squares... Read More
Don't Ignore This Chart! April 16, 2013 at 03:14 PM
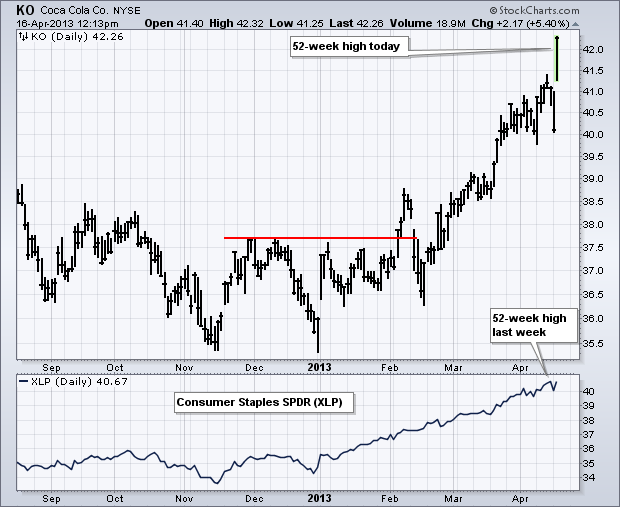
After falling 2.5% on Monday, Coca-Cola (KO) recovered with a 5+ percent surge to lead the Consumer Staples SPDR (XLP) higher on Tuesday. KO Has been one of the top performing stocks in 2013 and XLP has been one of the top performing sectors... Read More
Don't Ignore This Chart! April 15, 2013 at 08:55 AM
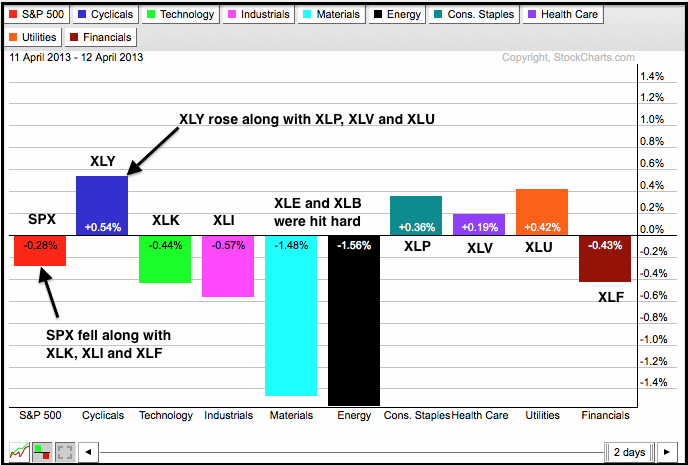
Friday was a rather strange day for the sector SPDRs. Notice that the consumer discretionary, consumer staples, healthcare and utilities SPDRs moved higher... Read More
Don't Ignore This Chart! April 12, 2013 at 03:13 PM
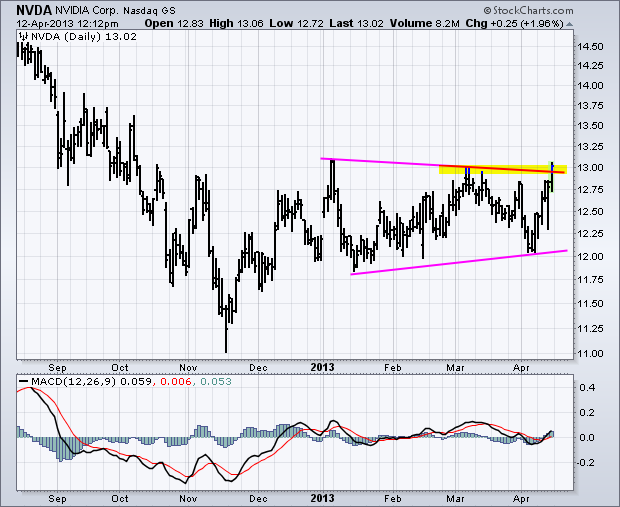
Stocks were down in early trading on Friday, but Nvidia (NVDA) got off to a strong start with a surge above 13 and a three month high. NVDA formed a triangle from January to April and broke the upper trend line with this advance... Read More
Don't Ignore This Chart! April 11, 2013 at 03:11 PM
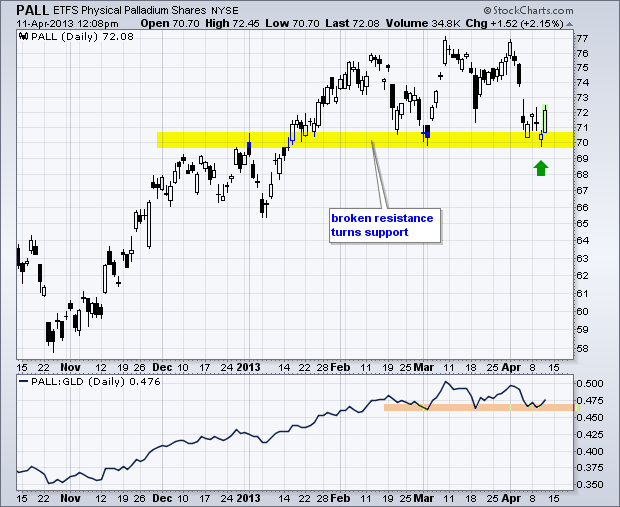
The Palladium ETF (PALL) fell along with gold last week, but managed to firm near the early March low and bounce off support today. Notice that broken resistance turned into support in the 70 area. The indicator window shows PALL relative to the Gold SPDR (GLD)... Read More
Don't Ignore This Chart! April 10, 2013 at 07:06 PM
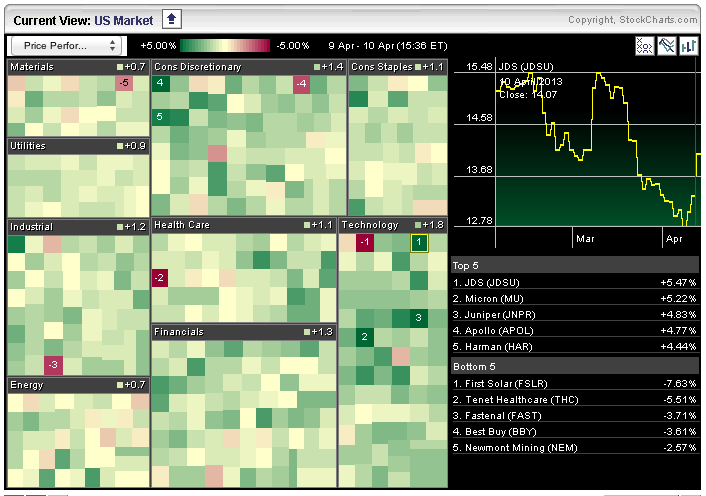
The Sector Market carpet is full of green on Wednesday with the average tech stock up 1.8%. JDS Uniphase, Micron and Juniper are leading the way. There are, however, some big losers today with First Solar, Tenet and Fastenal down over 3%. These can be seen with the red boxes... Read More
Don't Ignore This Chart! April 09, 2013 at 08:45 PM
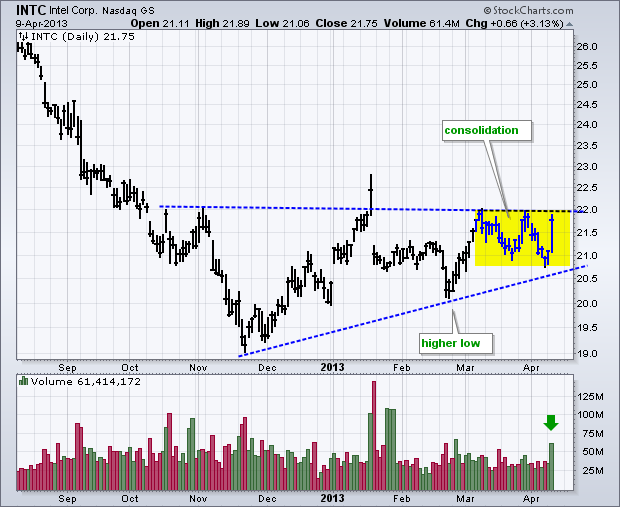
Intel gave a lift to the MarketVectors Semiconductor ETF (SMH) and Semiconductor SPDR (XSD) with a 3.13% advance on the highest volume since late February. Notice how the stock formed a higher low with the late February surge and then consolidated the last five weeks... Read More
Don't Ignore This Chart! April 08, 2013 at 11:29 AM
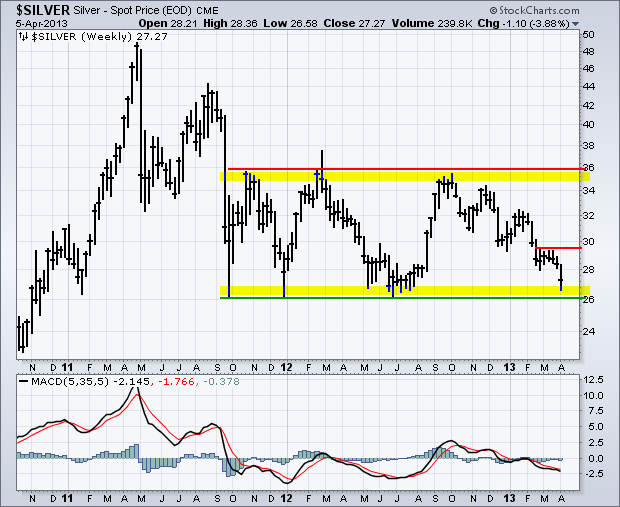
After falling sharply in April and September 2011, Spot Silver ($SILVER) moved into a trading range with resistance at 36 and support at 26. Silver has touched support at least three times and is poised to test this area again... Read More
Don't Ignore This Chart! April 06, 2013 at 06:03 PM
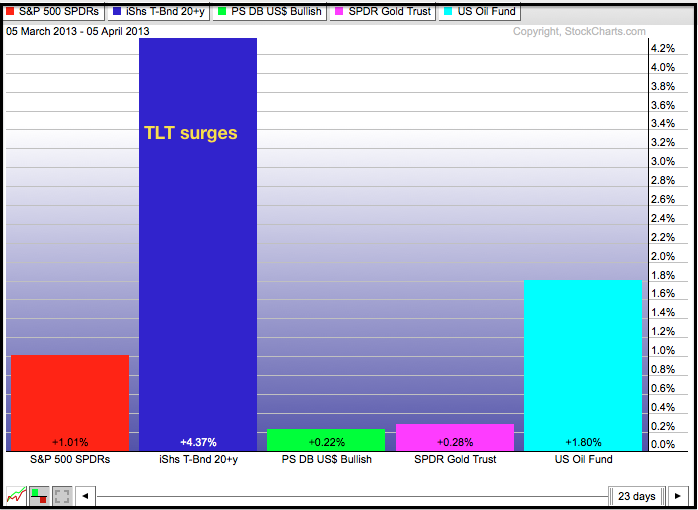
The PerfChart below shows five ETFs representing the inter-market picture. Even though the S&P 500 ETF (SPY) and the US Oil Fund (USO) are up over the past month. notice that the 20+ Year T-Bond ETF (TLT) is up a lot more... Read More
Don't Ignore This Chart! April 04, 2013 at 09:03 AM
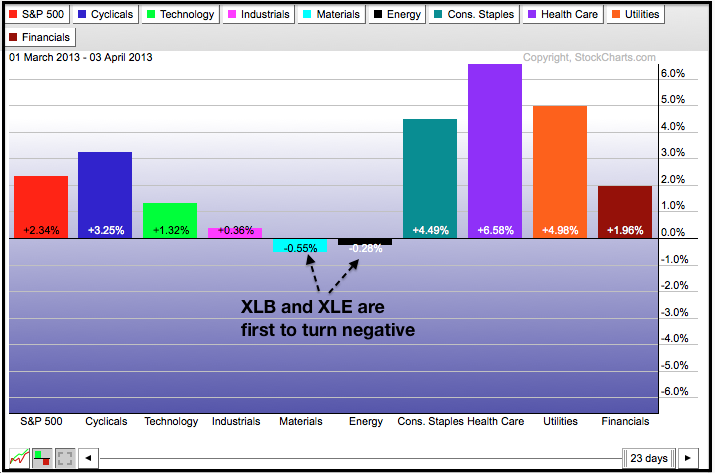
With a hard hit this week, the Energy SPDR (XLE) and the Materials SPDR (XLB) are now down month-to-date. In contrast, the S&P 500 and other seven sectors are still up since March 1st... Read More
Don't Ignore This Chart! April 03, 2013 at 08:30 PM
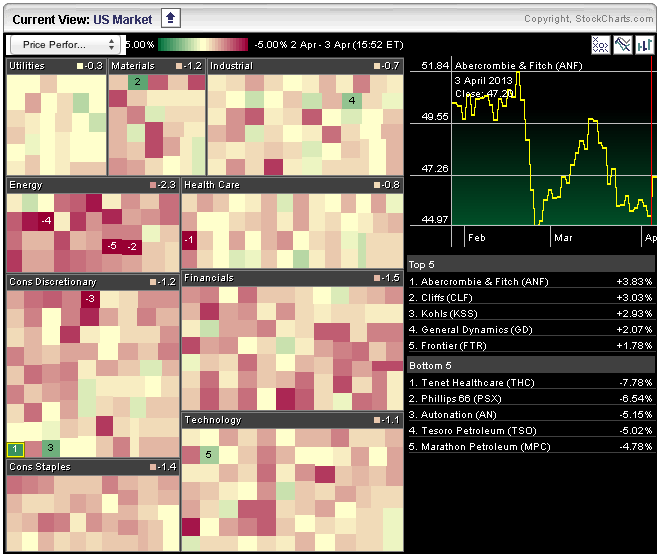
The market carpet was mostly red on Wednesday with pockets of deep red in the finance and energy sectors. The utilities sector held up the best as the average stock fell 30 cents... Read More
Don't Ignore This Chart! April 02, 2013 at 09:44 AM
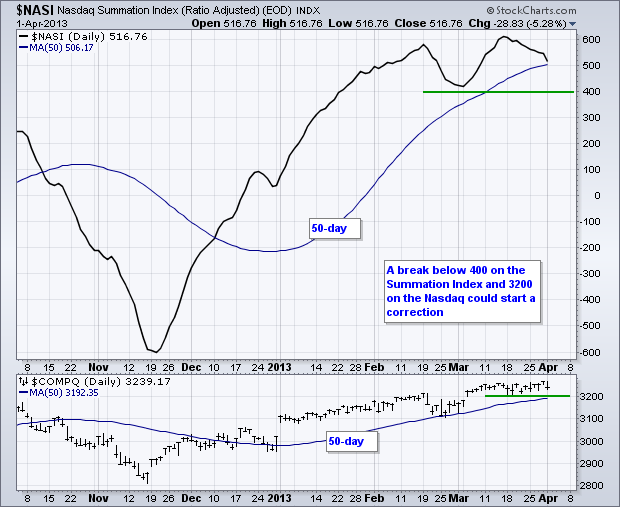
The Nasdaq Summation Index ($NASI) remains in an uptrend overall, but the indicator hit resistance near the February high and turned lower the last few weeks... Read More
Don't Ignore This Chart! April 01, 2013 at 09:50 AM
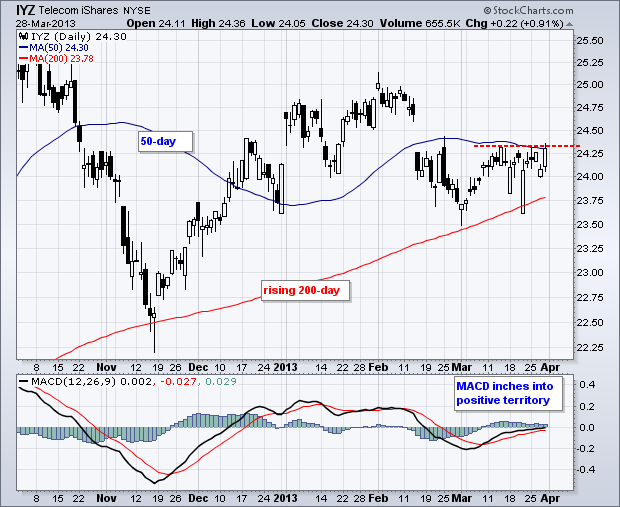
The Telecom iShares (IYZ) is finding support from the rising 200-day moving average and hitting resistance at the 50-day moving average. A move above the March highs would break the 50-day and keep the longer term uptrend alive... Read More