Don't Ignore This Chart! March 31, 2014 at 01:33 PM
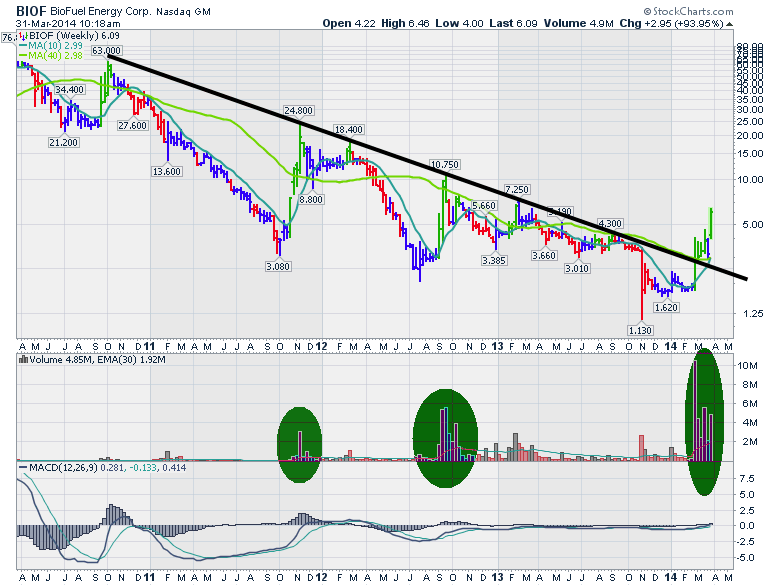
The ticker cloud on the home page had a new name on it today. BIOF was highlighted, so I clicked through. This stock really started to move a few weeks ago and look at the volume come piling in week after week... Read More
Don't Ignore This Chart! March 31, 2014 at 10:01 AM
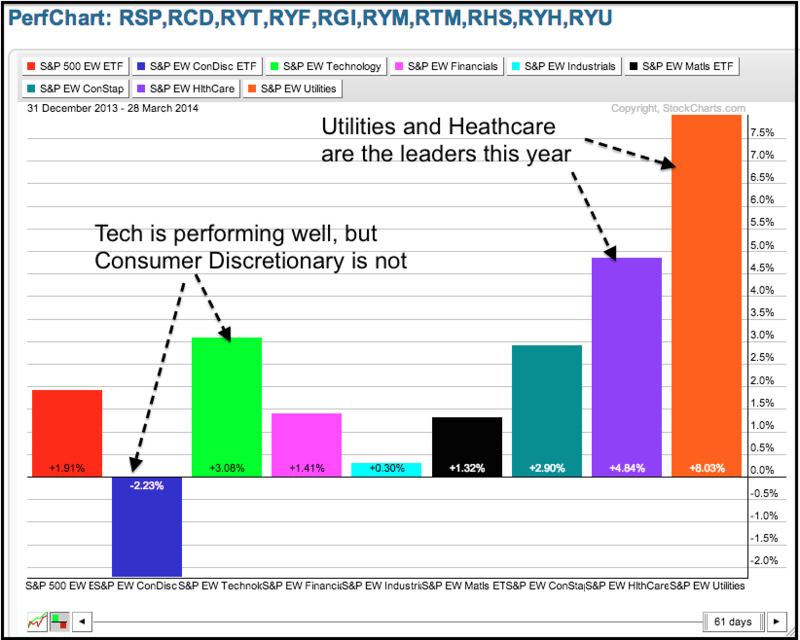
The Equal-weight Utilities ETF (RYU) is the best performing sector year-to-date with an 8% gain. The Equal-Weight Consumer Discretionary ETF (RCD) is the only sector in the red with a 2.23% loss... Read More
Don't Ignore This Chart! March 28, 2014 at 10:55 AM
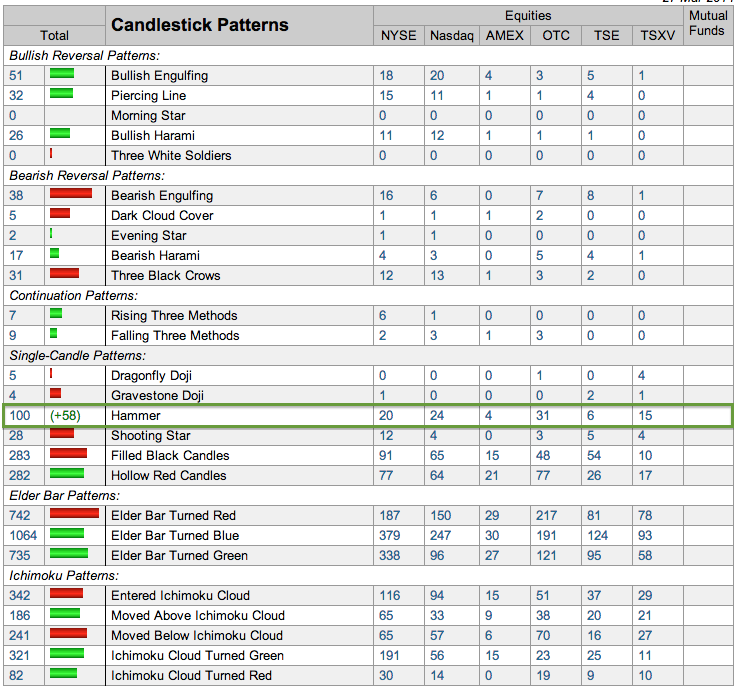
Chartists looking for specific candlestick reversal patterns should check out the predefined scans page, which is updated intraday and end-of-day. Thursday's end-of-day results show a surge in the number of hammers (from 42 to 100 for a +58 gain)... Read More
Don't Ignore This Chart! March 27, 2014 at 01:33 PM
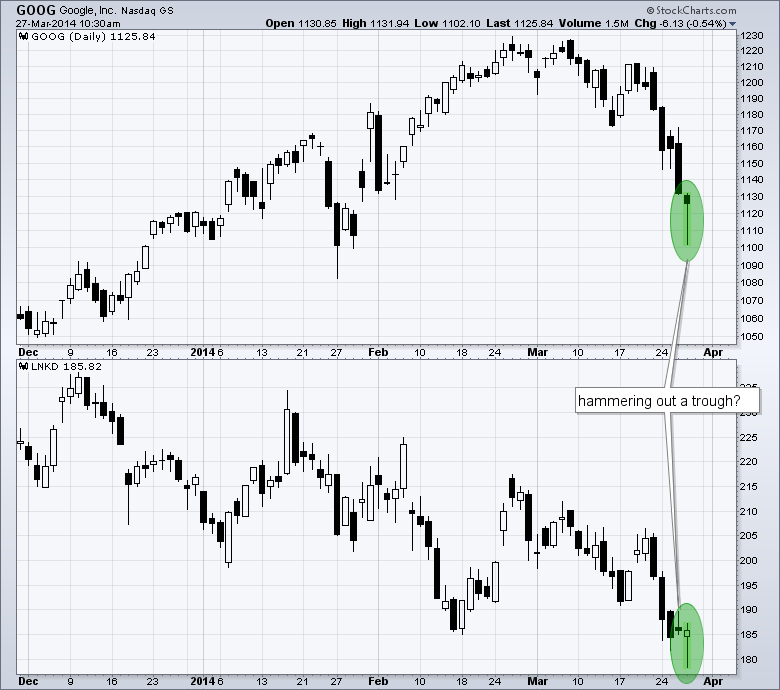
Google, LinkedIn and other momentum stocks fell sharply this month and became short-term oversold this week. Signs of a short-term low are emerging early Thursday as Google (GOOG) and LinkedIn (LNKD) trace out hammer patterns... Read More
Don't Ignore This Chart! March 26, 2014 at 08:03 PM
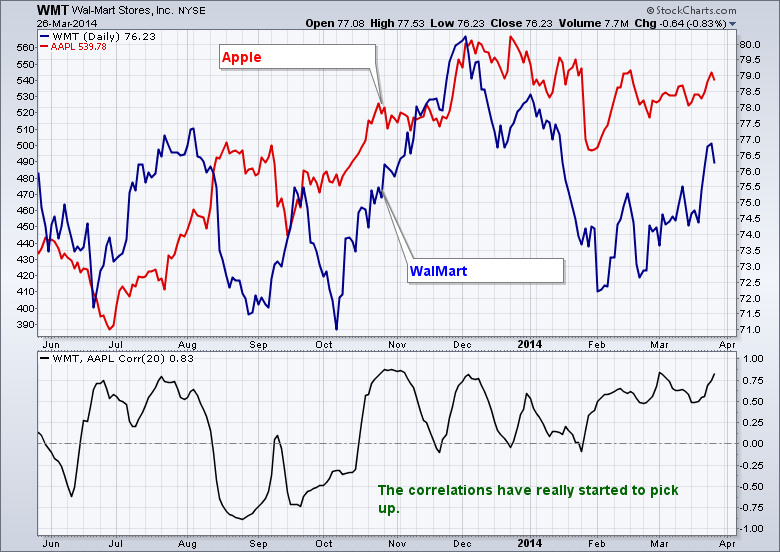
Apple was loved for growth earlier in the decade but it looks like it is now loved for cash flow. Recently WMT made a move above its 200 DMA and AAPL also started moving. That was intriguing... Read More
Don't Ignore This Chart! March 26, 2014 at 07:26 PM
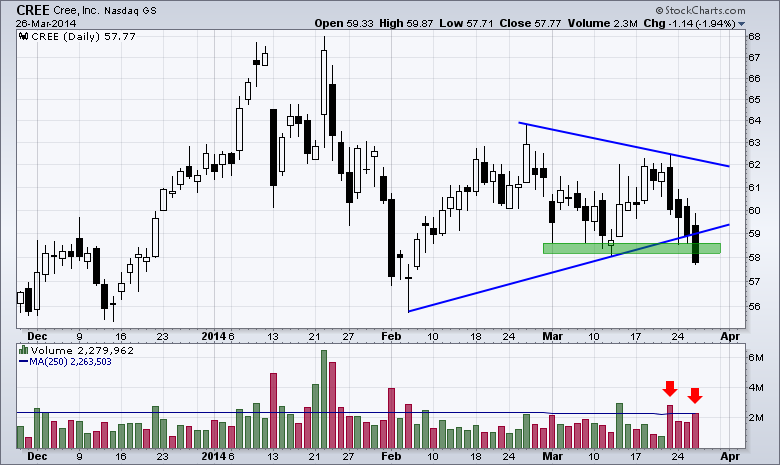
After lagging the market and the semiconductor group this year, CREE finally succumbed to selling pressure with a triangle break the last few days. Note that the S&P 500 SPDR and Semiconductor SPDR hit new highs in March, but CREE fell well short of its January high... Read More
Don't Ignore This Chart! March 25, 2014 at 02:16 PM
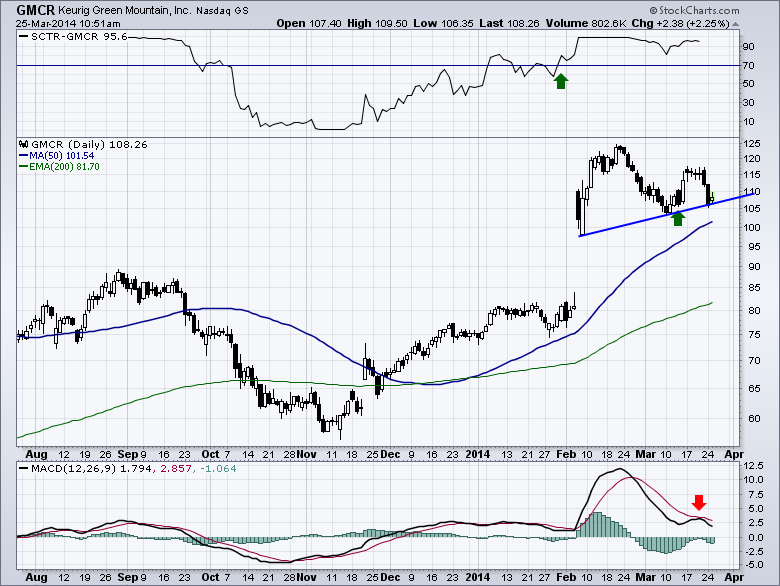
GMCR recently signed a partnership with Coca Cola. The stock absolutely rocked higher. It pulled back, I posted the chart with the green arrow, showing the climb out of the valley. Well, here we are a few days later. The MACD failed to give us a positive cross... Read More
Don't Ignore This Chart! March 24, 2014 at 02:24 PM
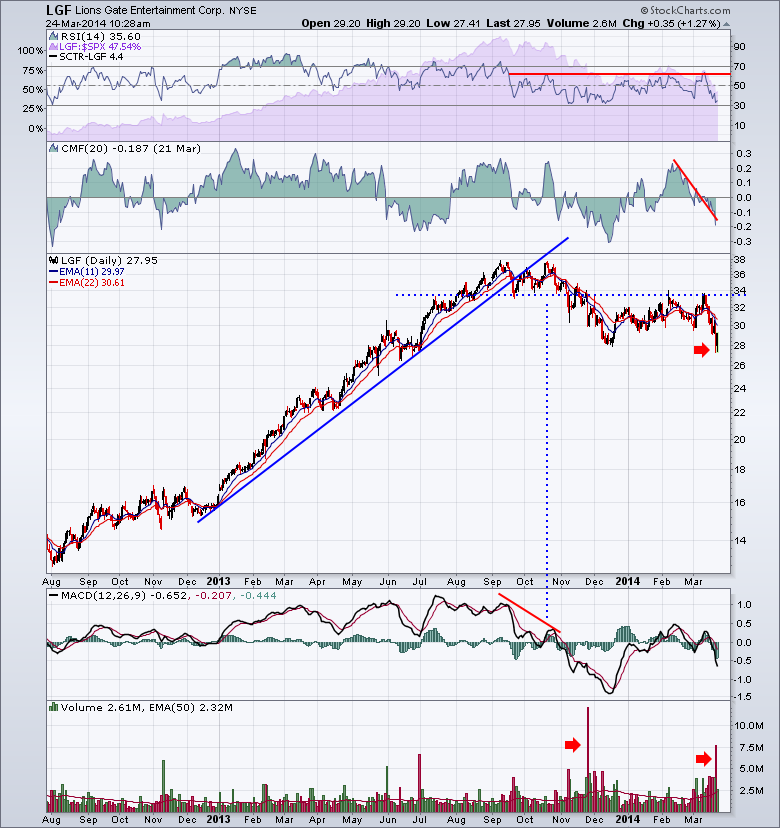
Lions Gate Entertainment LGF released Divergent as the first in a 3 part trilogy with Insurgent and Allegiant yet to come. The stock was also divergent... Read More
Don't Ignore This Chart! March 19, 2014 at 02:18 PM
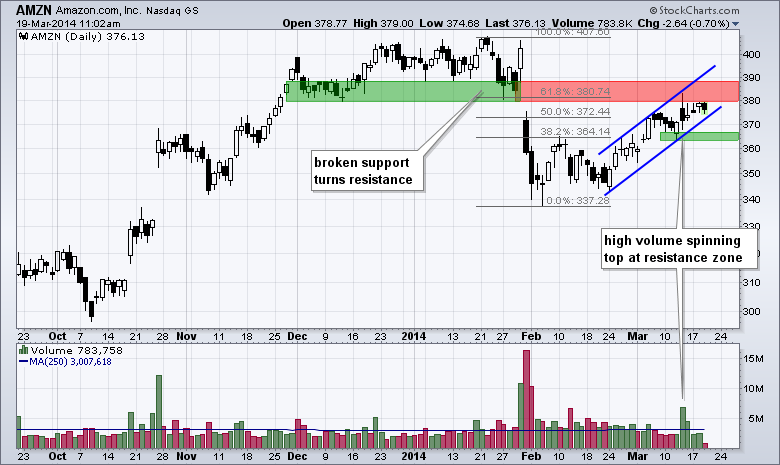
Amazon (AMZN) remains in a short-term uptrend, but the stock is nearing a potential reversal zone. First, notice that the stock broke down with high volume in late January... Read More
Don't Ignore This Chart! March 19, 2014 at 11:40 AM
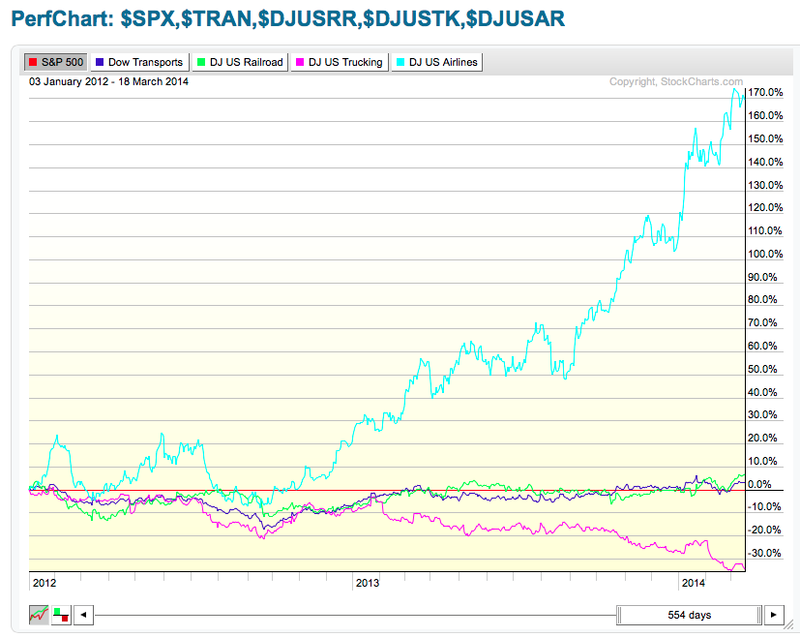
I was looking through the charts last night and came across this gem. It is a chart of the Transportation Indexes. I have set the slider to cover off two years of data. I wanted to show the relatively flat trend of all the transports in 2012... Read More
Don't Ignore This Chart! March 18, 2014 at 08:25 PM
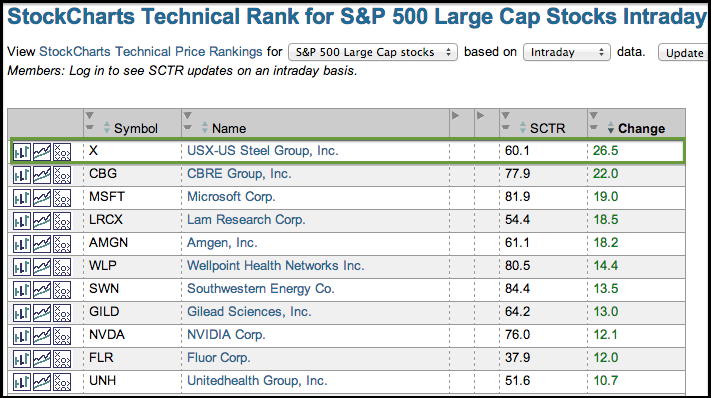
US Steel (X) is getting a bounce off support on the price chart and its SCTR is breaking above 50 with a big move. This list below shows eleven S&P 500 stocks with the biggest changes in their StockCharts Technical Rank (SCTR)... Read More
Don't Ignore This Chart! March 14, 2014 at 03:02 PM
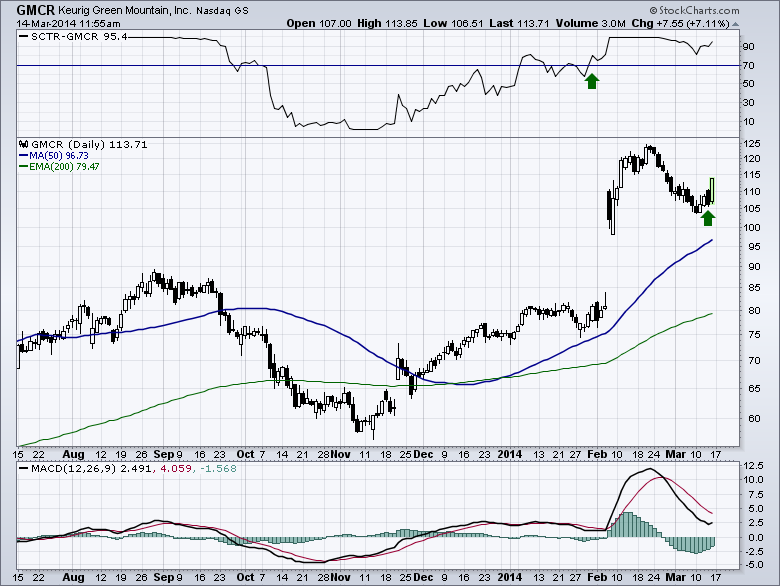
Looking through the ticker cloud today, and noticed some interest showing up on GMCR. After clicking on the chart, I see why. Recently, it gapped up. It pulled back to test support of the gap, and looks to have reversed here... Read More
Don't Ignore This Chart! March 13, 2014 at 11:35 PM
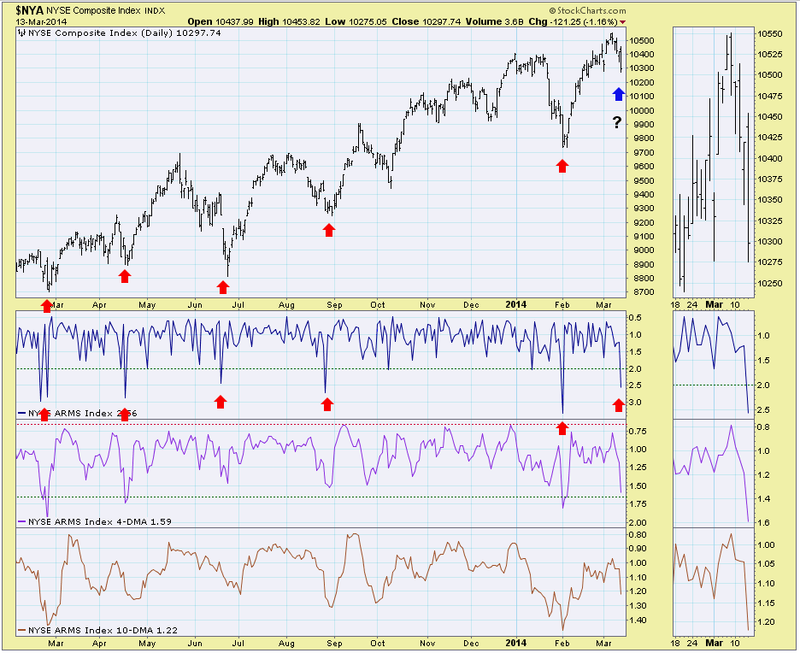
On a day with plenty of selling, you will often see a downward spike in the TRIN reading. Readings of over 2.0 are frequently followed by a price rebound the following day. Indeed, many of these high readings actually precede price bottoms... Read More
Don't Ignore This Chart! March 13, 2014 at 03:41 AM
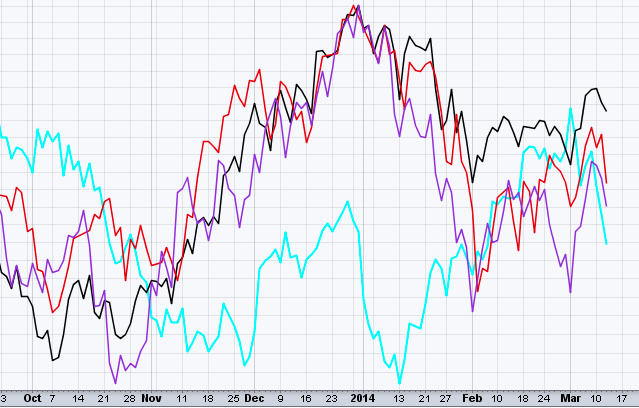
When flipping through the charts, sometimes you see a certain sequence of events show up. Obviously the $COMPQ, $RUT, $SPX,$INDU track each other. Sometimes, different components rotate to outperform. Currently that is the case with the $INDU underperforming... Read More
Don't Ignore This Chart! March 12, 2014 at 09:31 PM
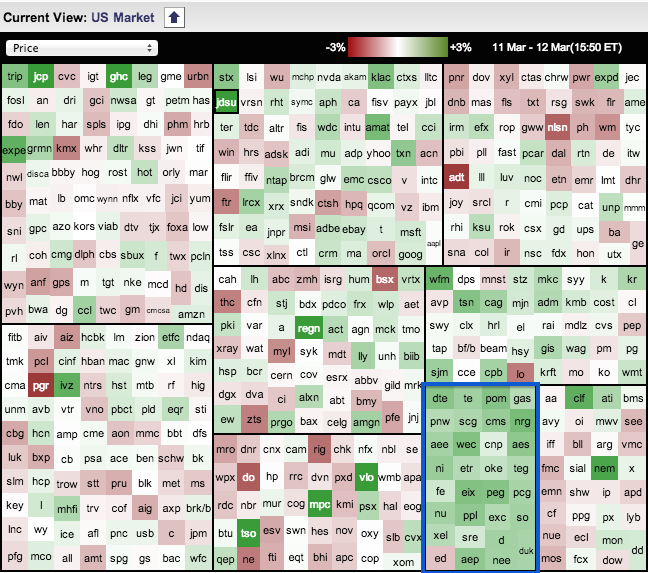
Stocks in the utilities sector stood out on Wednesday. As the Sector MarketCarpet below shows, the utilities sector has the most, and darkest, green of the nine sectors (blue outline). Only one square (ED) was red... Read More
Don't Ignore This Chart! March 11, 2014 at 09:20 PM
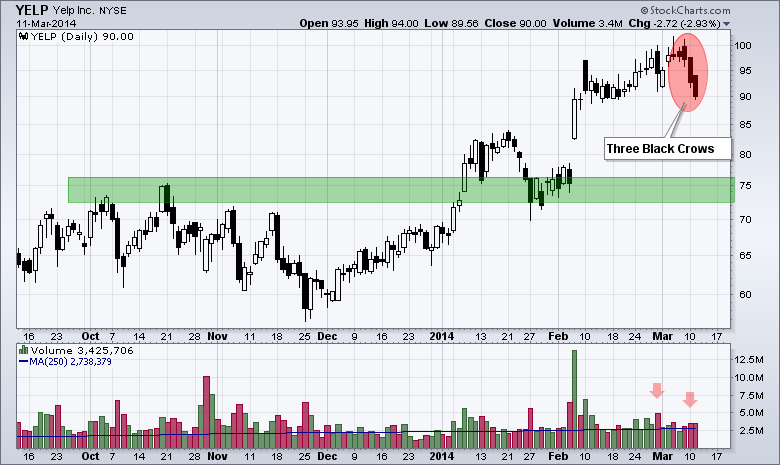
Yelp ($YELP) came across the Three Black Crows scan on Tuesday. It all started with a black candlestick three days ago (Friday). The stock then opened above the Friday's close on Monday and sold off to form another black candlestick... Read More
Don't Ignore This Chart! March 07, 2014 at 03:19 PM
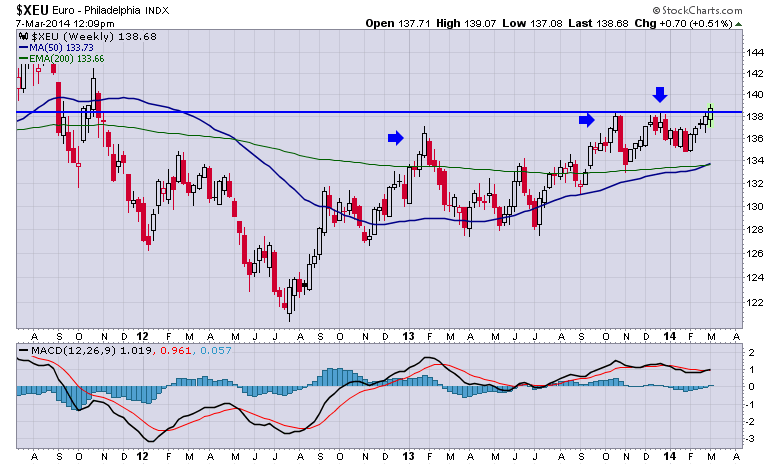
The Euro continues to push higher. It seems to have more momentum currently. The last three breakouts only lasted a week. However, at the last breakout, the $XEU chart spent 4 weeks hovering below resistance. This week we have surged to new highs once again... Read More
Don't Ignore This Chart! March 07, 2014 at 08:31 AM
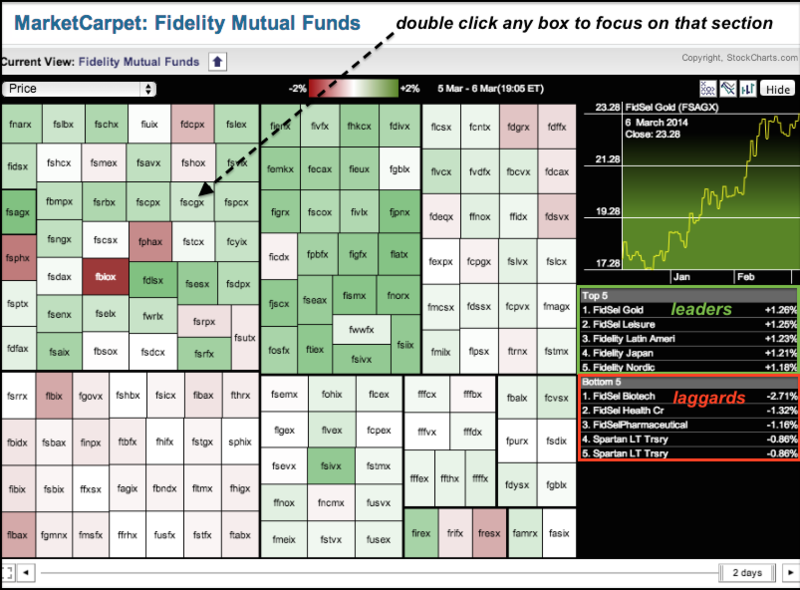
Chartists can identify mutual fund leaders and laggards using the Rydex, Fidelity and Profunds MarketCarpets. Note that these are updated after the market close... Read More
Don't Ignore This Chart! March 06, 2014 at 07:48 PM
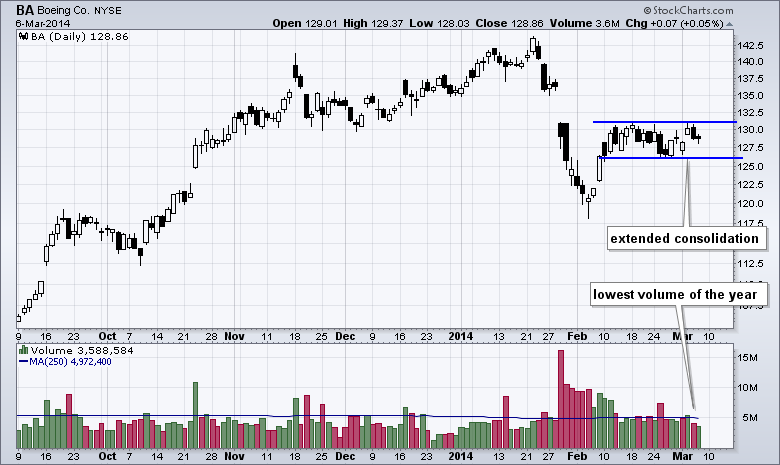
Boeing (BA) took a hit in January, rebounded in early February and then moved into a tight consolidation. Volatility has slowed to a crawl as the stock traded between 126 and 131 since February 11th... Read More
Don't Ignore This Chart! March 05, 2014 at 04:39 PM
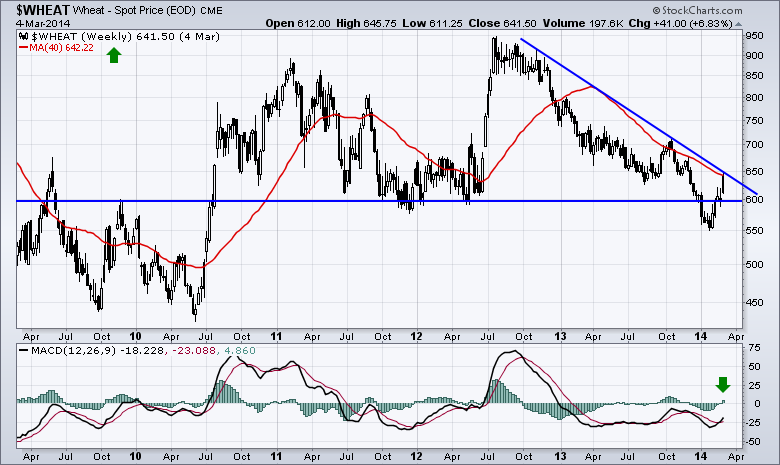
In the Market Message last week, I wrote about the fact that all the commodities were doing so well, with the exception of Wheat. Well, what a difference after the situation in Ukraine elevated. Wheat was hanging around a major support/ resistance line at 600... Read More
Don't Ignore This Chart! March 04, 2014 at 05:36 PM
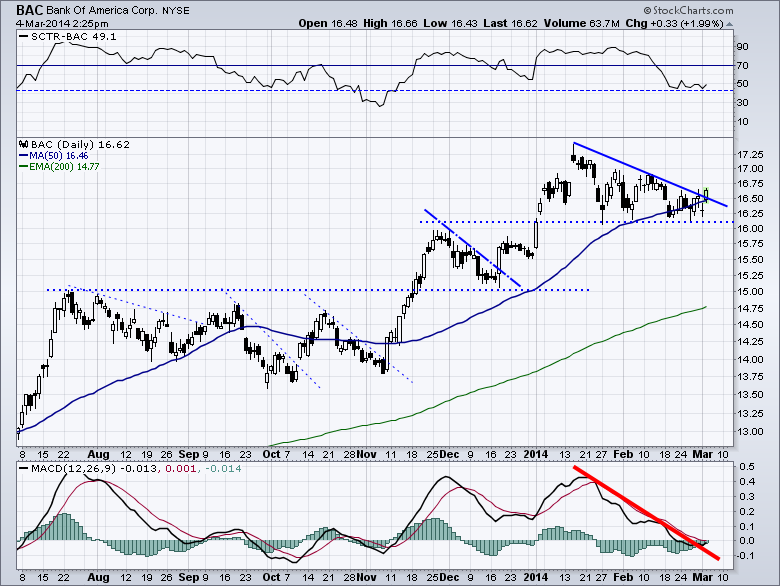
Bank of America has been running since Warren Buffet stepped in at around $5.00. Running up that is. It's pretty nice chart, with excellent support and resistance lines. The SCTR seems to float between 45 and 90... Read More
Don't Ignore This Chart! March 04, 2014 at 09:13 AM
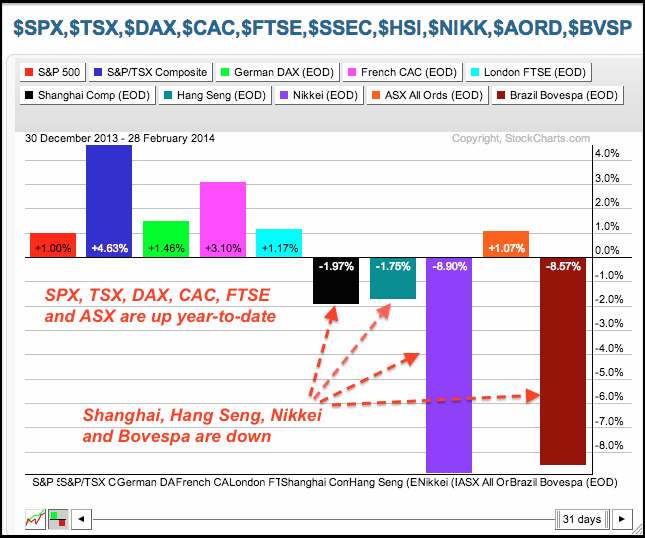
The PerfChart below shows the year-to-date performance for ten country indices. Notice that US, European and Australian stocks are up this year. Asia shows some weakness because the Shanghai Composite, Hang Seng Composite and Nikkei 225 are down... Read More
Don't Ignore This Chart! March 03, 2014 at 01:58 PM
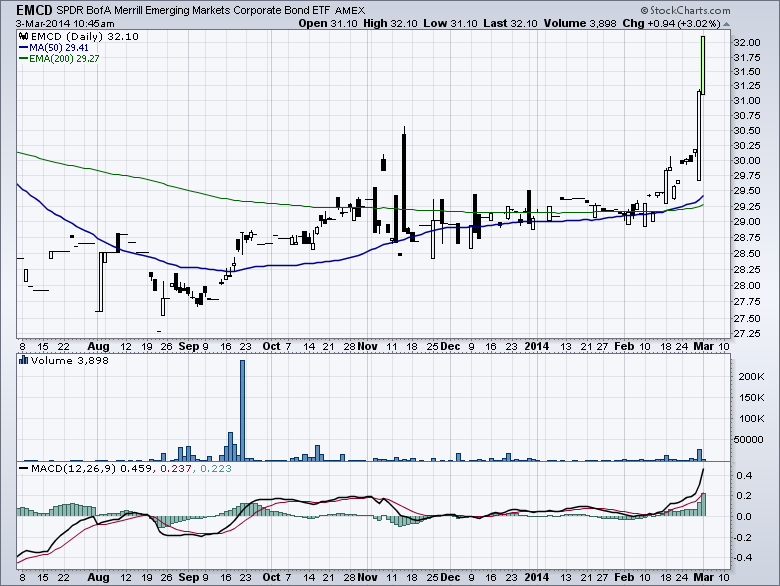
On days with the potential for major trend changes, I like to look around to see what might be moving that I did not expect. Today, I came across this ETF. It is the Bank of America - Emerging Market Corporate Bond ETF. This is a 52 Week High Break out. Now the volume is tiny... Read More
Don't Ignore This Chart! March 03, 2014 at 11:29 AM
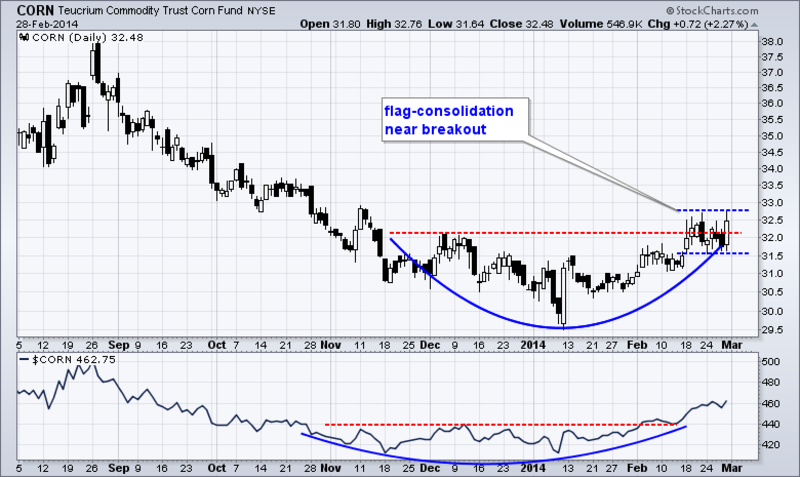
The Corn Trust ETF (CORN) sports a rounding bottom and breakout over the last few months. The rounding bottom extends from mid November to the end of February with a big bullish engulfing in the middle... Read More