Don't Ignore This Chart! June 30, 2016 at 12:41 PM
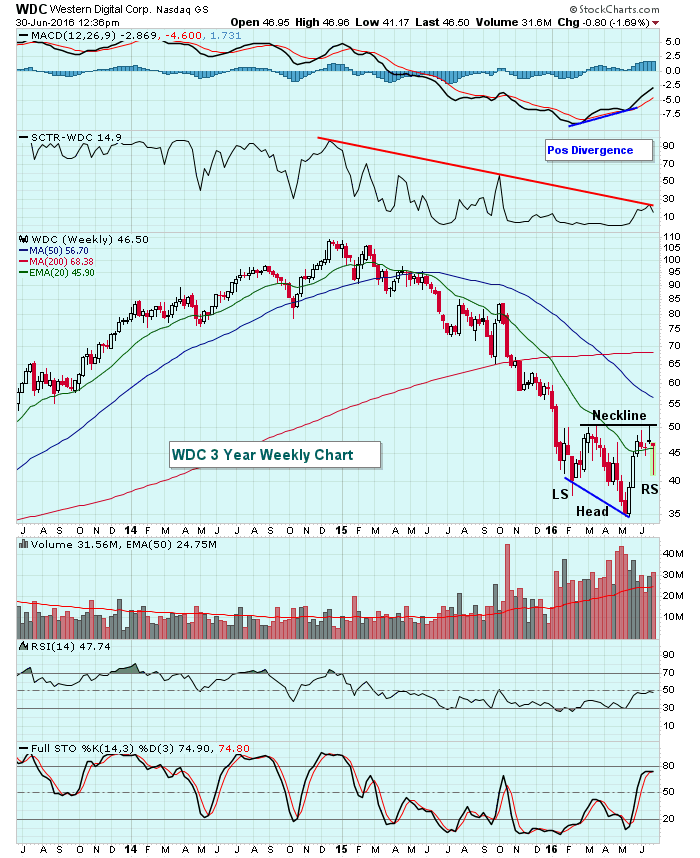
There's a potential bottoming reverse head & shoulders pattern in play on Western Digital's (WDC) three year weekly chart as it attempts to clear its downtrend on its SCTR. All of this comes on the heels of printing a positive divergence on its MACD... Read More
Don't Ignore This Chart! June 29, 2016 at 11:06 AM
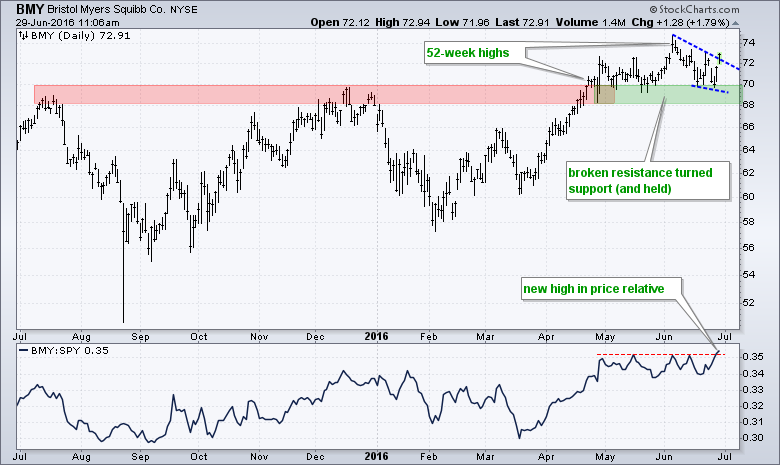
Chartists need just two plots to find leaders and stocks in uptrends: price and the price relative. Price, of course, can be a line chart, bar chart or candlestick chart. Stocks hitting 52-week highs are in clear uptrends and often leading the market... Read More
Don't Ignore This Chart! June 28, 2016 at 06:26 PM
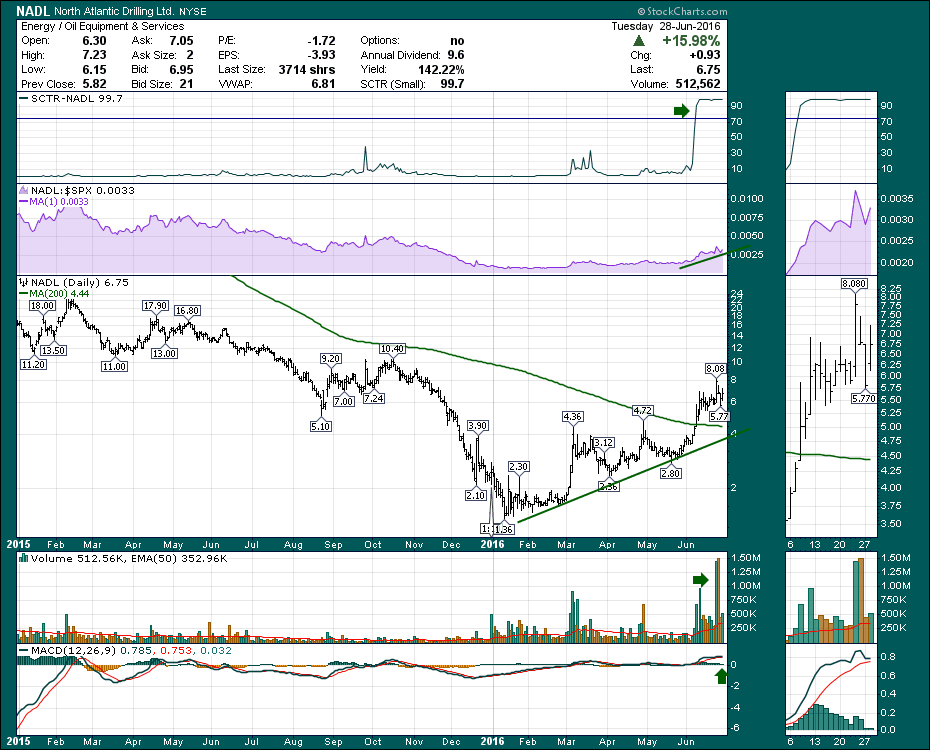
North Atlantic Drilling (NADL) has been off a lot of the investing community's radar as it was such a beaten down stock in an area that everyone expects to stay bearish forever... Read More
Don't Ignore This Chart! June 27, 2016 at 10:33 AM
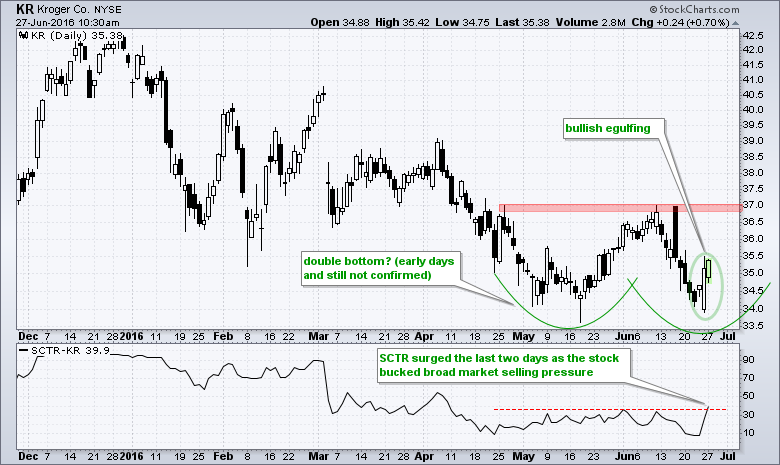
Stocks were hit hard on Friday and again early Monday, but Kroger (KR) bucked the selling pressure with a bullish engulfing on Friday and further gains early Monday... Read More
Don't Ignore This Chart! June 25, 2016 at 02:59 PM
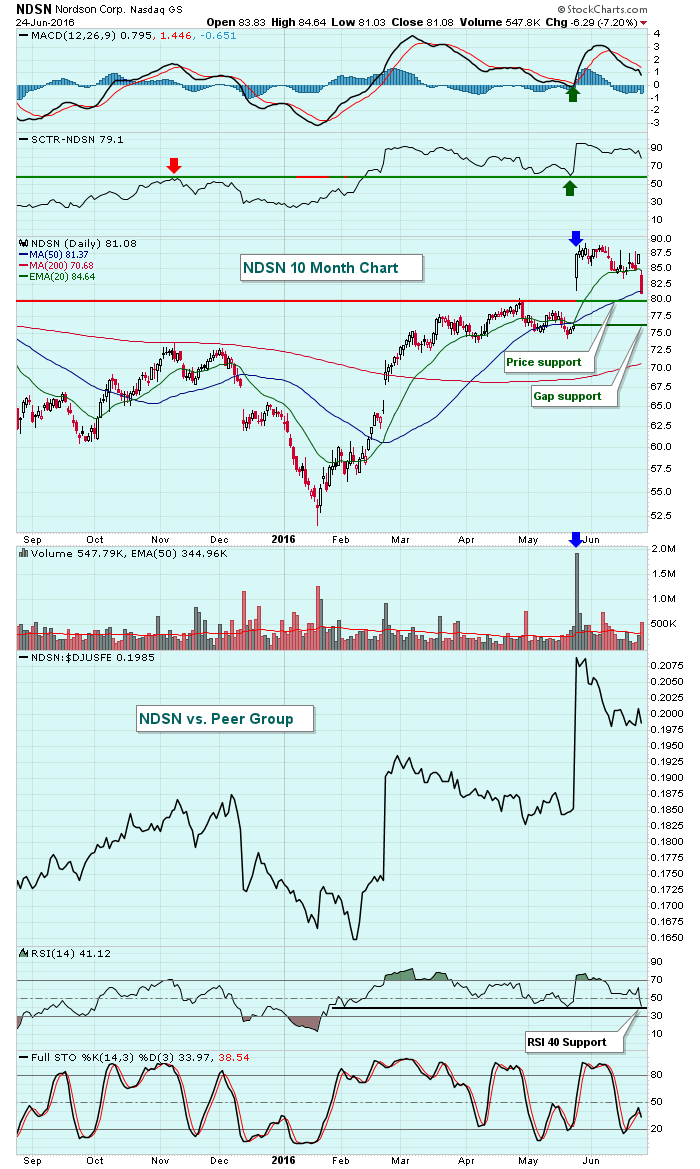
After the stock market closed on May 23rd, Nordson Corp (NDSN) reported quarterly earnings results that absolutely blew away Wall Street's consensus estimates... Read More
Don't Ignore This Chart! June 24, 2016 at 10:50 AM
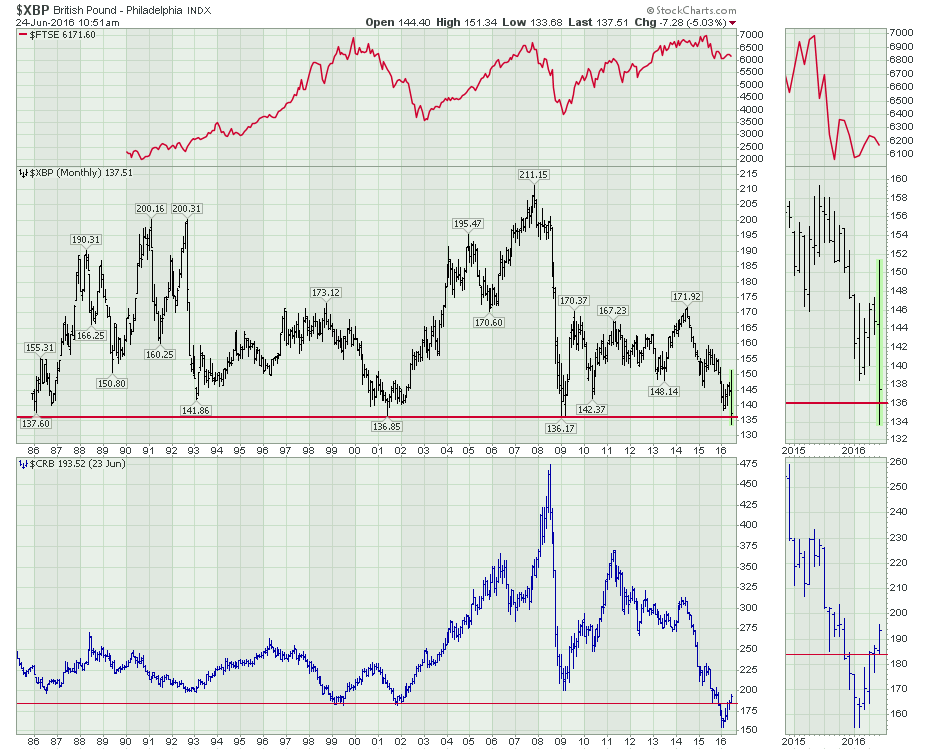
The British Pound ($XBP) made historical lows this morning. While this chart is trying to find support at the $136 level, there is no doubt that we are experiencing a moment in time that could mark a significant long-term trend change... Read More
Don't Ignore This Chart! June 23, 2016 at 10:32 AM
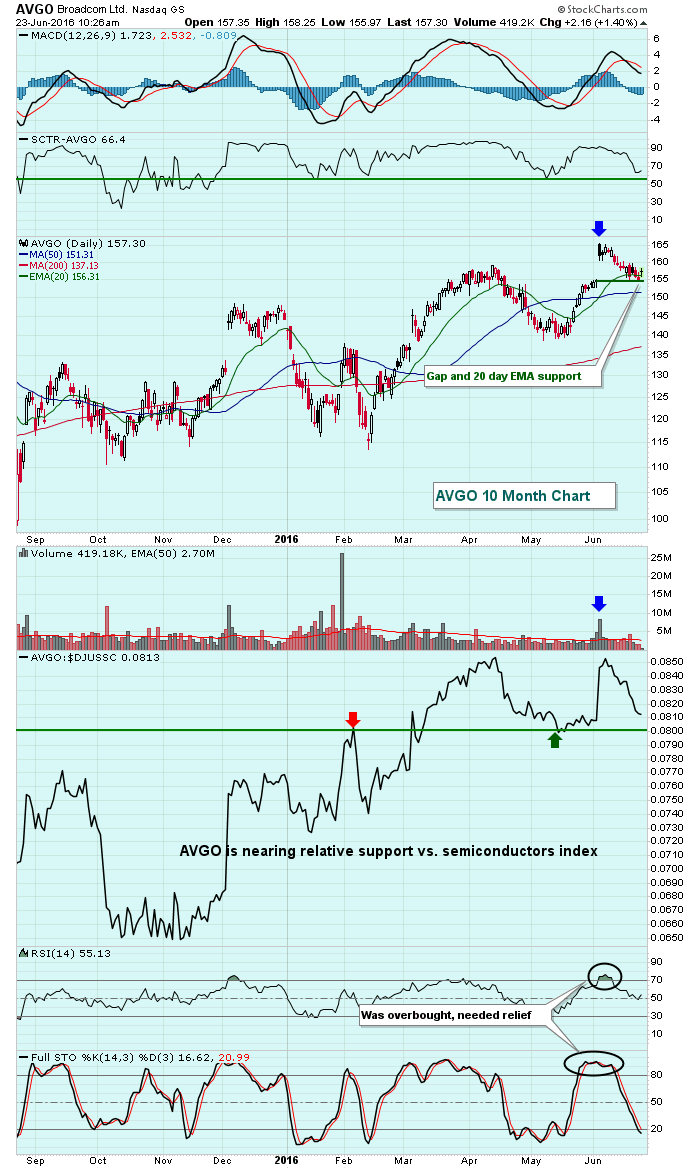
Broadcom (AVGO) posted quarterly EPS in early June that topped Wall Street forecasts and the stock gapped higher from 155 to above 165. Now, just a few weeks later, AVGO has returned to the scene of the crime, testing gap support and its rising 20 day EMA... Read More
Don't Ignore This Chart! June 22, 2016 at 02:24 PM
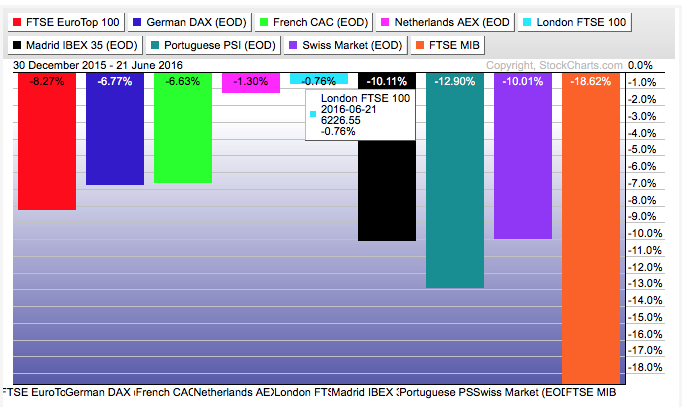
The London FTSE is still down year-to-date, but it is the best performing index in Europe for 2016. The PerfChart below shows year-to-date performance for nine European stock indexes. The London FTSE is in the middle (light blue) and down less than 1% this year... Read More
Don't Ignore This Chart! June 20, 2016 at 12:01 PM
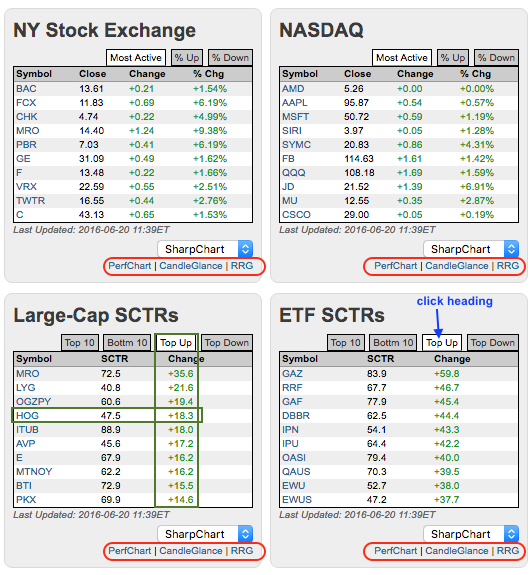
Chartists looking for the movers and shakers of the day need look no further than the StockCharts home page. Tables for most actives and SCTRs can be found midway down on the left-hand side... Read More
Don't Ignore This Chart! June 17, 2016 at 10:12 AM
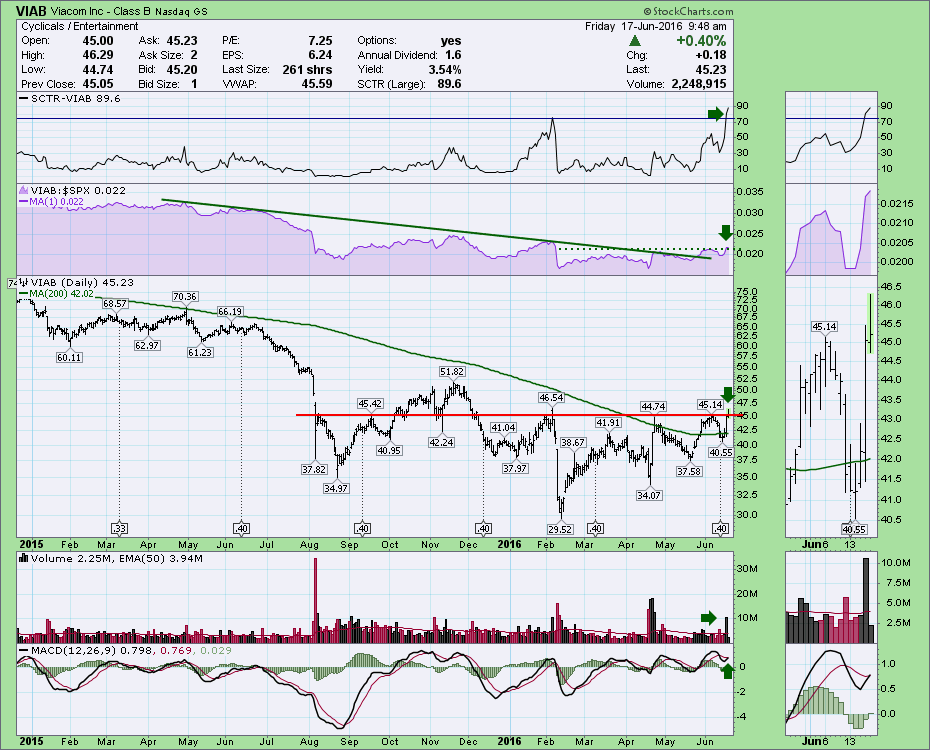
Viacom (VIAB) stock is in the crosshairs of the Sumner Redstone battle. With so many issues surrounding the stock, it seems to be a disaster in progress... Read More
Don't Ignore This Chart! June 16, 2016 at 10:49 AM
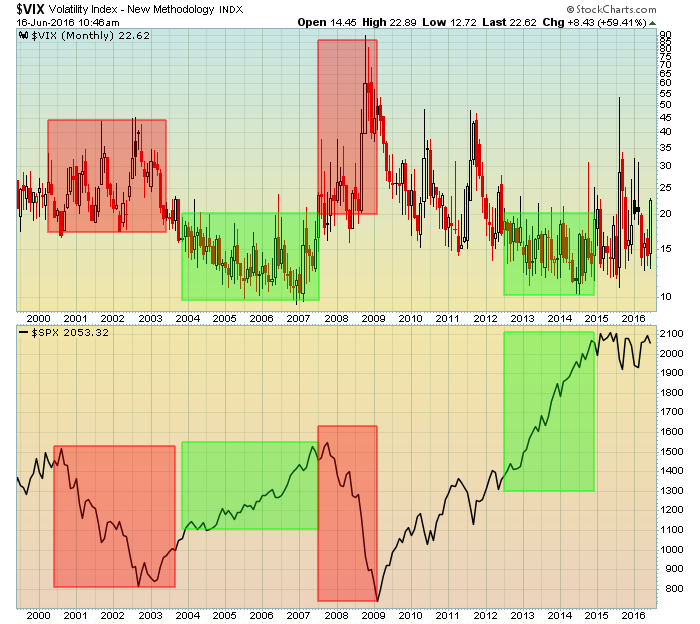
The Volatility Index ($VIX) is often times referred to as the fear index and fear is a necessary component of bear markets. So the recent surge in the VIX should not be taken lightly... Read More
Don't Ignore This Chart! June 15, 2016 at 09:21 AM
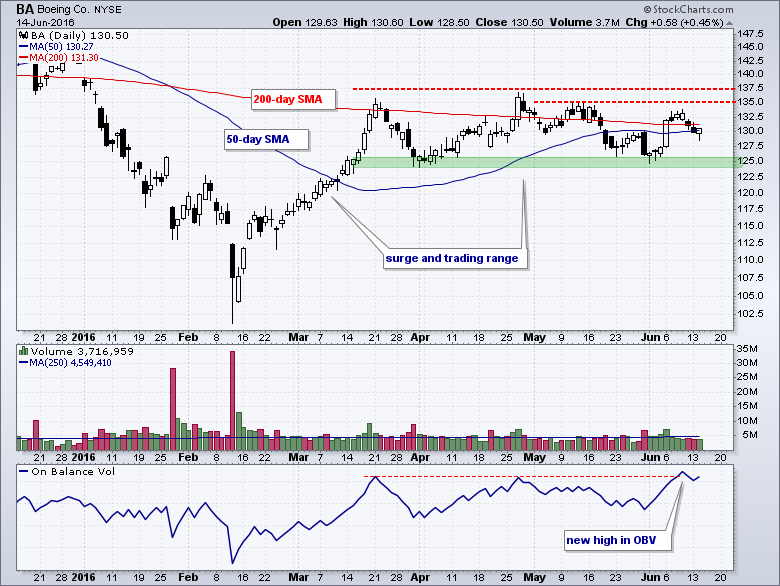
Boeing has been stuck in a trading range since late March and signs of accumulation suggest an upside breakout. On the price chart, notice that BA surged from the 102 area to 135 from mid February to mid March... Read More
Don't Ignore This Chart! June 15, 2016 at 12:54 AM
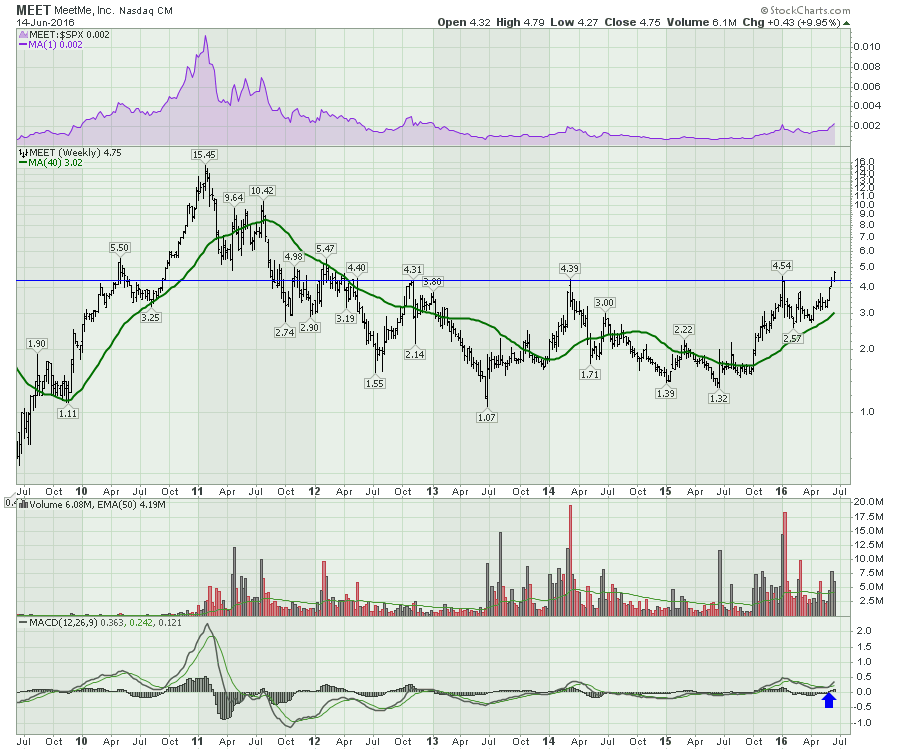
The dating stocks have been performing quite well recently. This week, MeetMe (MEET) is breaking out from a large base. Last month I featured Match.com (MTCH) as it was starting to perform better. Today, MeetMe broke out to new highs... Read More
Don't Ignore This Chart! June 13, 2016 at 11:53 AM
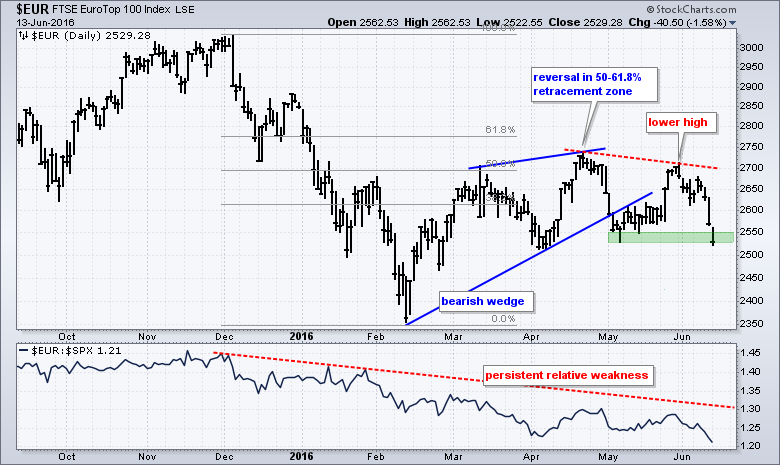
Large-caps in Europe continue to underperform large-caps in the US and the EuroTop 100 ($EUR) is breaking down on the price chart. First, the price chart shows $EUR falling sharply from December to mid February and then recovering 50-61... Read More
Don't Ignore This Chart! June 12, 2016 at 06:56 PM
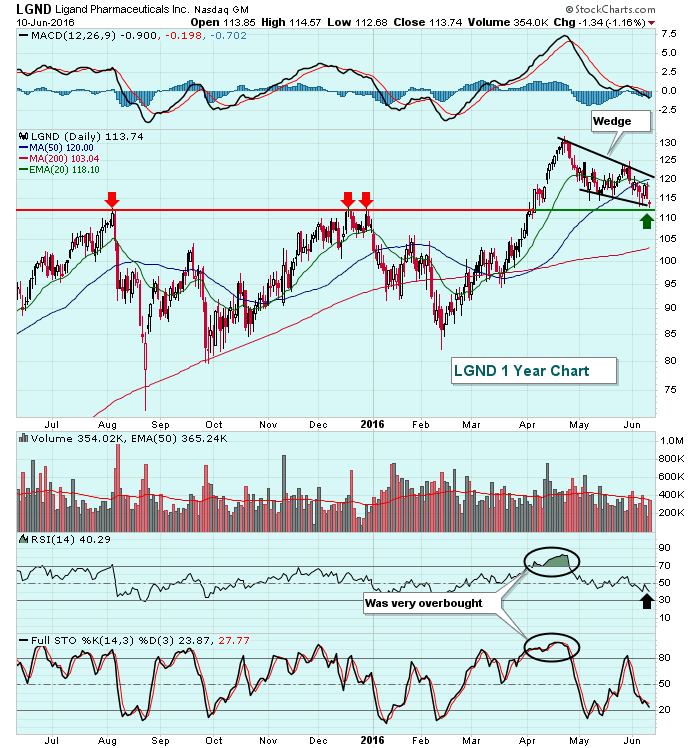
Ligand Pharmaceutical (LGND) broke out above price resistance in April with solid volume confirmation. But the stock was extremely overbought and in need of a pullback to unwind its momentum oscillators. RSI had touched the 80s with stochastic elevated in the 90s... Read More
Don't Ignore This Chart! June 10, 2016 at 10:41 AM
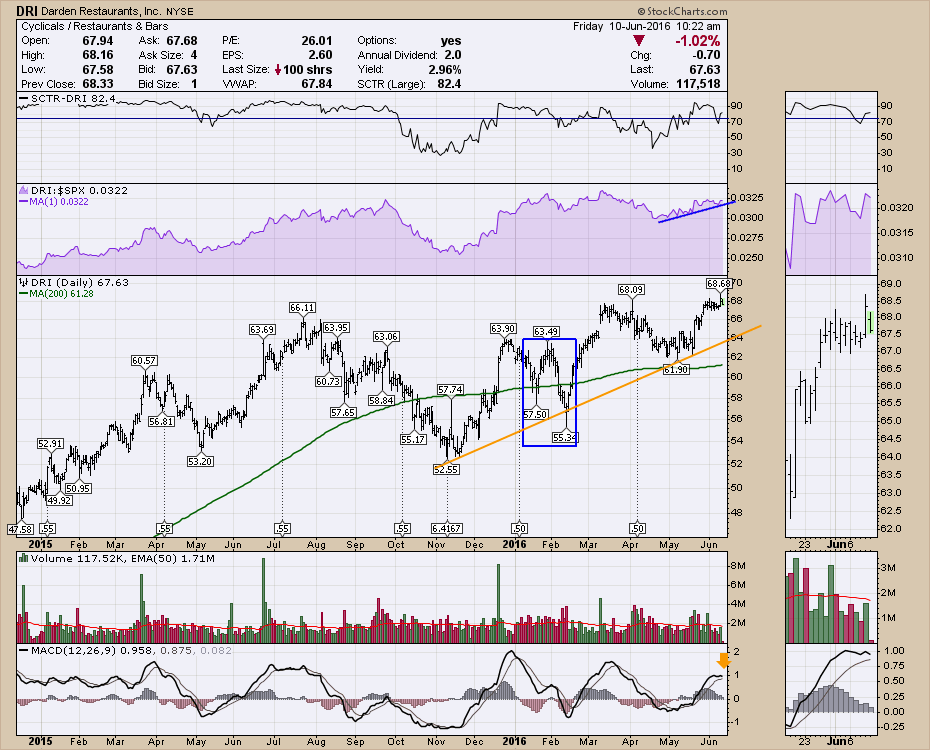
Darden Restaurants (DRI) stroked a new high on Thursday's down day. The owner of Capital Grille, LongHorn Steakhouse and Eddie V's is continuing to outperform. The chart has a few nice traits on it that deserve mention... Read More
Don't Ignore This Chart! June 09, 2016 at 04:27 PM
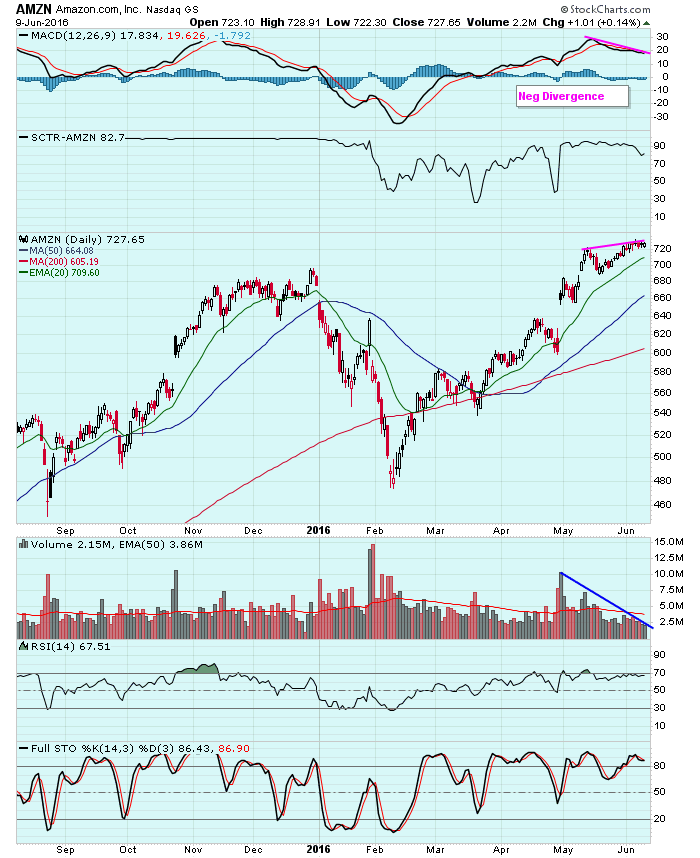
Amazon.com (AMZN) has been one of the strongest performers in 2016 and just recently broke out on a relative basis vs. the S&P 500 when it impressed Wall Street with its latest quarterly earnings results... Read More
Don't Ignore This Chart! June 08, 2016 at 11:35 AM
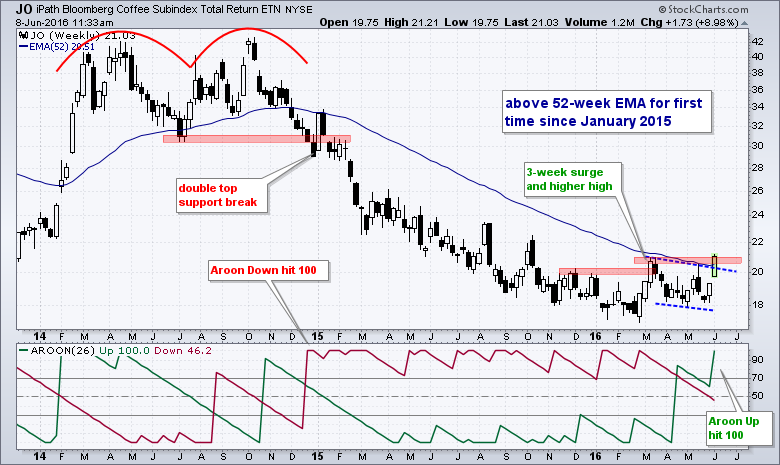
The Coffee ETF (JO) is one of leading commodity ETFs this week with an 8+ percent gain in just three days. The chart shows JO trending lower from the October 2014 peak until the February 2014 trough... Read More
Don't Ignore This Chart! June 07, 2016 at 06:23 PM
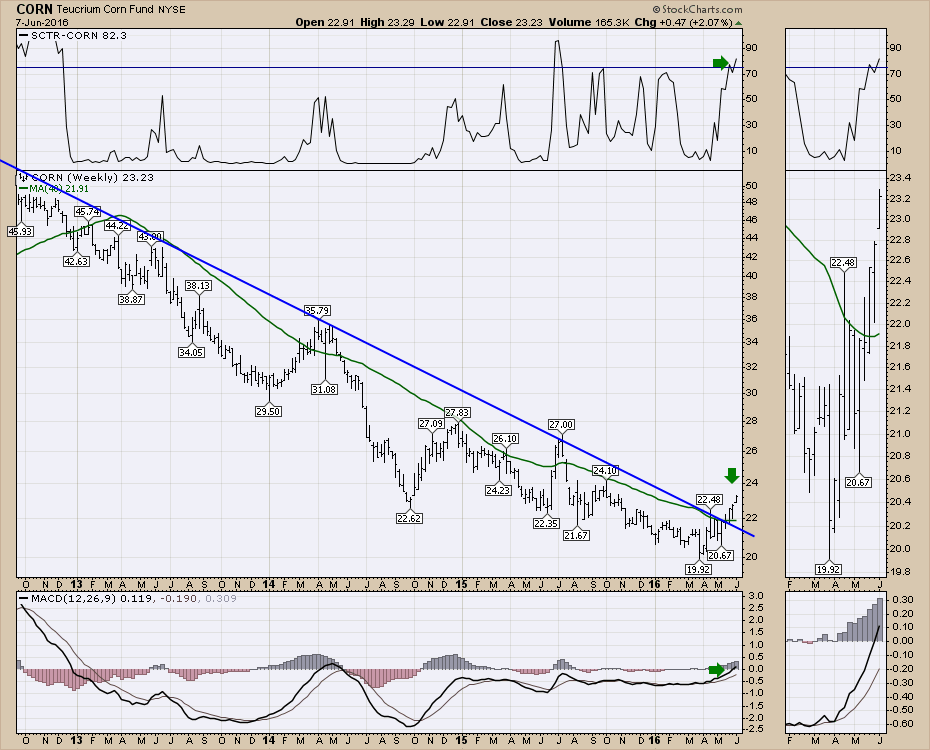
Corn is an interesting product. Normally associated with food, it has become a bit of an energy play for the ethanol component. Now that oil is rallying above $40, Corn (CORN) seems to be getting a bid... Read More
Don't Ignore This Chart! June 06, 2016 at 12:08 PM
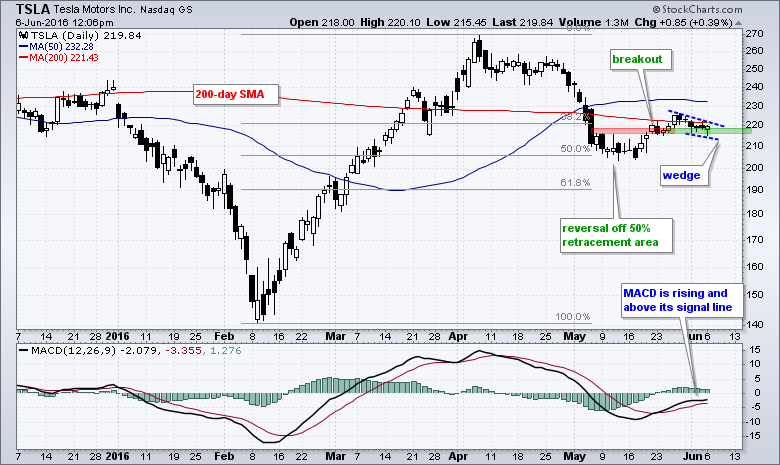
Tesla was hit hard in early May, but the stock managed to reverse near the 50% retracement and a bullish wedge is taking shape near the 200-day simple moving average. The stock surged from 140 to 270 from mid February to early April... Read More
Don't Ignore This Chart! June 05, 2016 at 03:48 PM
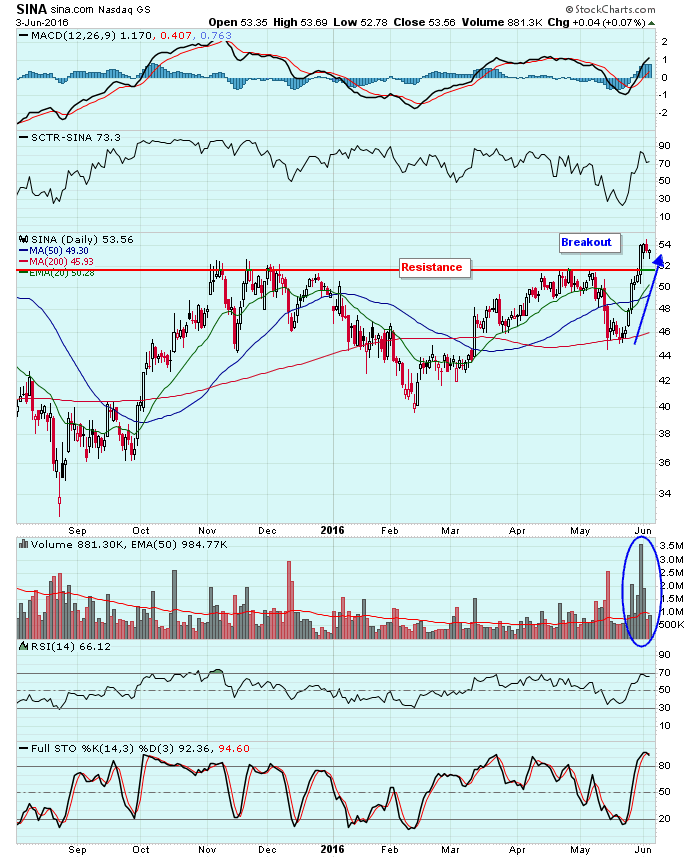
Sina (SINA) has just seen its SCTR rank break above 70 as its price has broken above multiple tops near 52. Volume on the breakout was very strong, topping 3 million shares for the first time since July 2015... Read More
Don't Ignore This Chart! June 02, 2016 at 11:05 PM
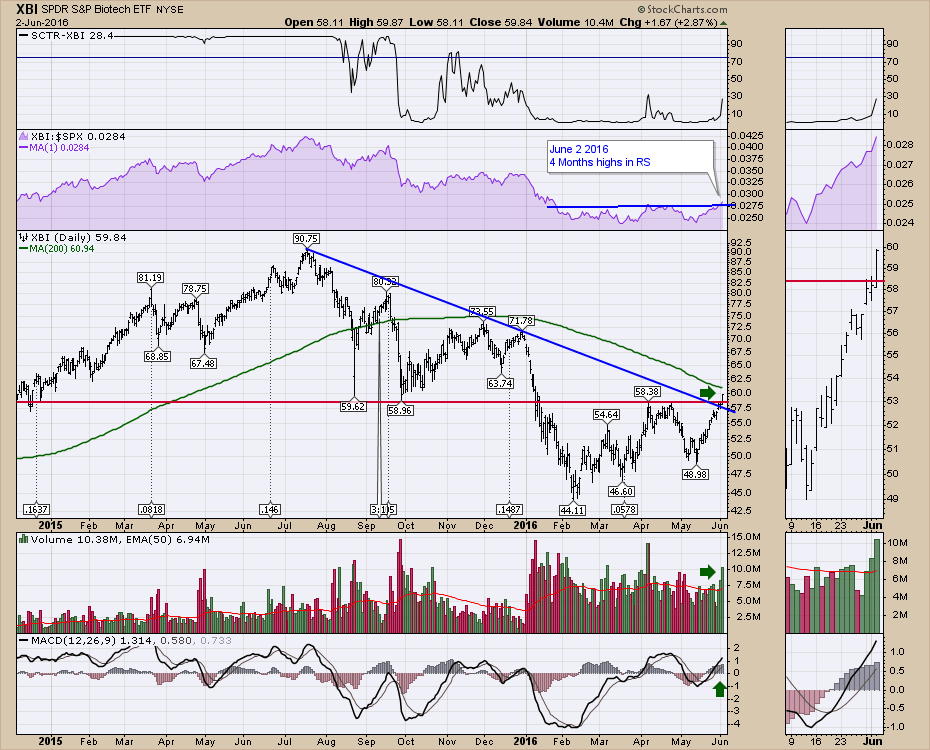
The Biotechs topped out almost a year ago. With all the new technology in cancer treatment, and a few biotech conferences next week, the rotation towards Biotech is in full gear... Read More
Don't Ignore This Chart! June 02, 2016 at 10:46 AM
The S&P 500 continues to battle overhead price resistance that's been well established since closing at its all-time high on May 21, 2015... Read More
Don't Ignore This Chart! June 01, 2016 at 11:48 AM
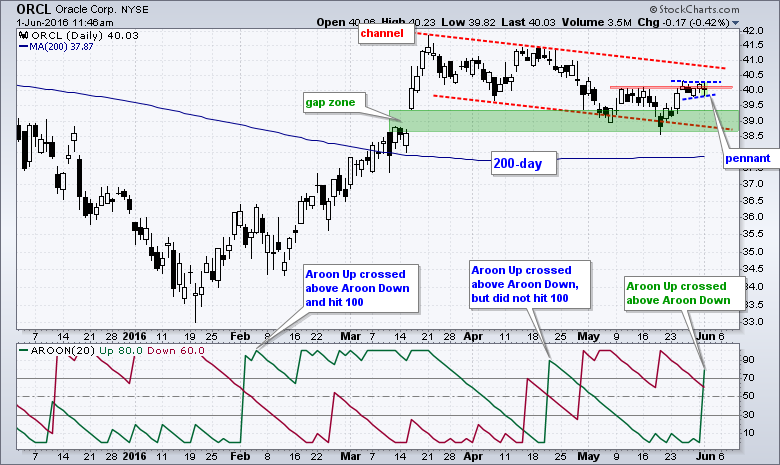
Oracle broke above its 200-day moving average back in early March and then pulled back over the last ten weeks. There are signs that this pullback is ending because Aroon Up just surged above Aroon Down... Read More