Don't Ignore This Chart! October 31, 2016 at 04:59 PM
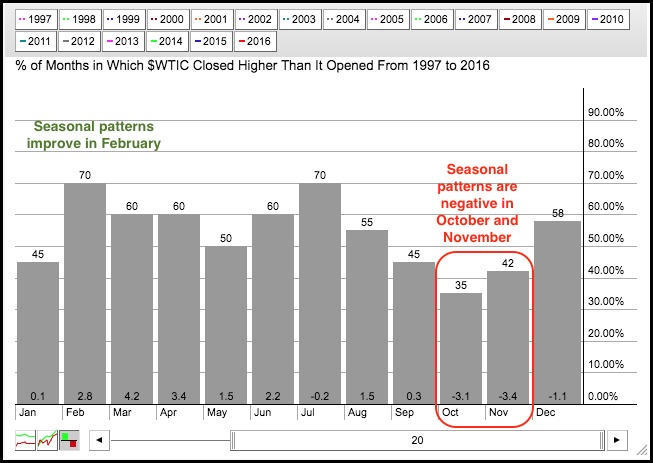
Light Crude fell sharply on the last trading day of October and ended the month down. Crude even poked its head above $52 twice during the month, but fell sharply the last two weeks of October and ended below $47... Read More
Don't Ignore This Chart! October 30, 2016 at 09:31 AM
There are basic technical analysis 101 principles and perhaps none more significant than the premise of price support and price resistance. During an uptrend, think of support and resistance as you would traveling higher in an elevator in an office building... Read More
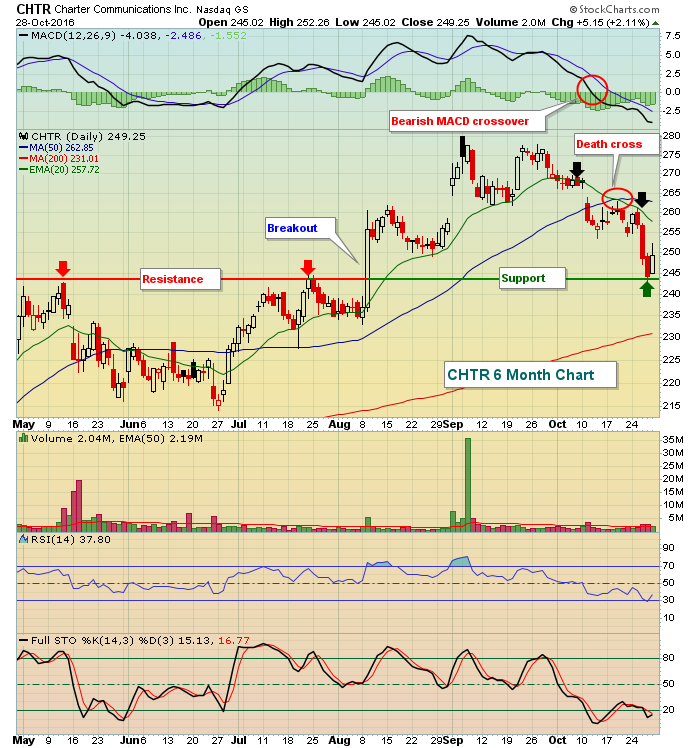
Don't Ignore This Chart! October 28, 2016 at 07:41 PM
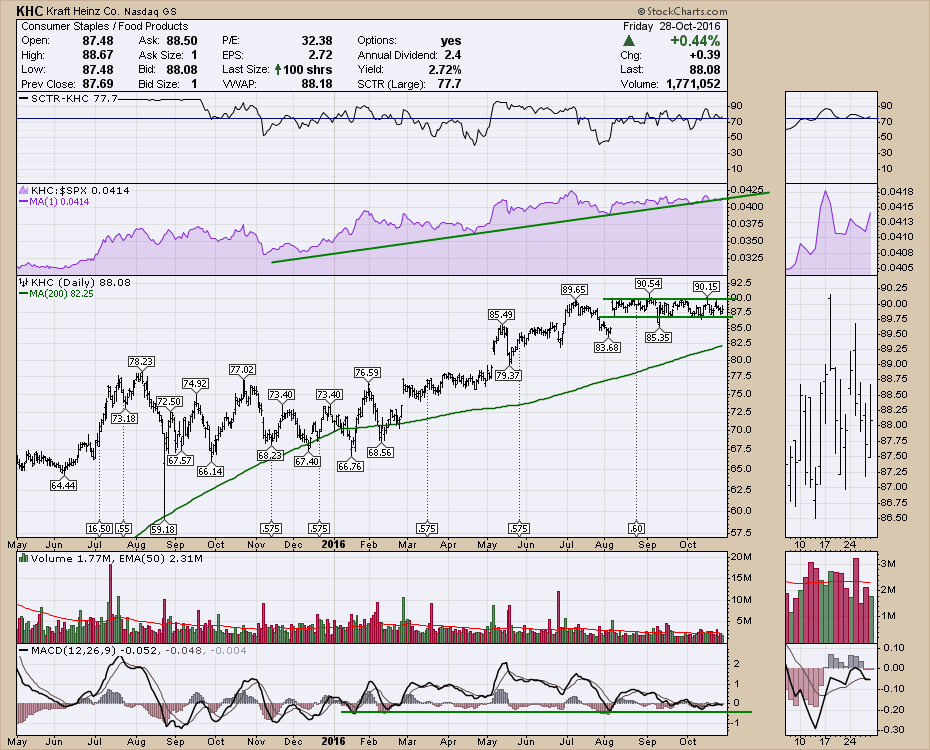
I spent a significant portion of my webinar discussing the market situation currently. I presented a number of charts that have me concerned about the market direction. So with that as a backdrop, finding strong defensive stocks could be a good balance of offence and defence... Read More
Don't Ignore This Chart! October 27, 2016 at 04:59 PM
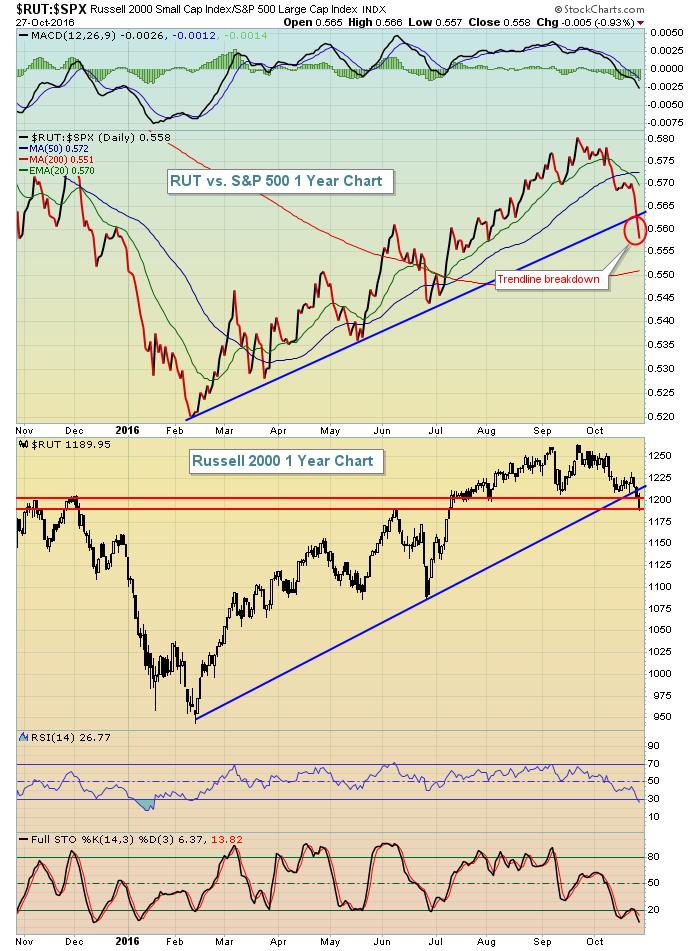
Small cap stocks tumbled today, losing 1.23% and far exceeding losses incurred on the other major indices. Since Monday's close, the Russell 2000 has dropped approximately 3% while the benchmark S&P 500 has retreated less than 1%... Read More
Don't Ignore This Chart! October 26, 2016 at 10:25 AM
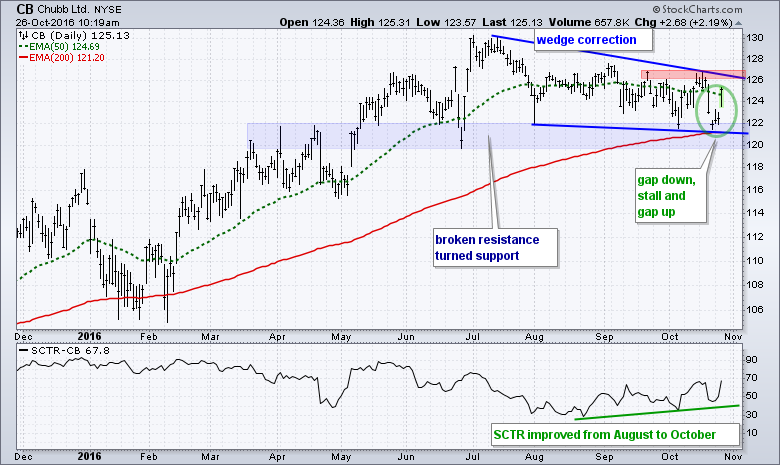
Chubb trended lower from July to October, but a gap-laden reversal off a big support zone suggests that this decline may be reversing. More importantly, this decline looks like a correction with a bigger uptrend. Let's look at the evidence for a long-term uptrend... Read More
Don't Ignore This Chart! October 25, 2016 at 06:55 PM
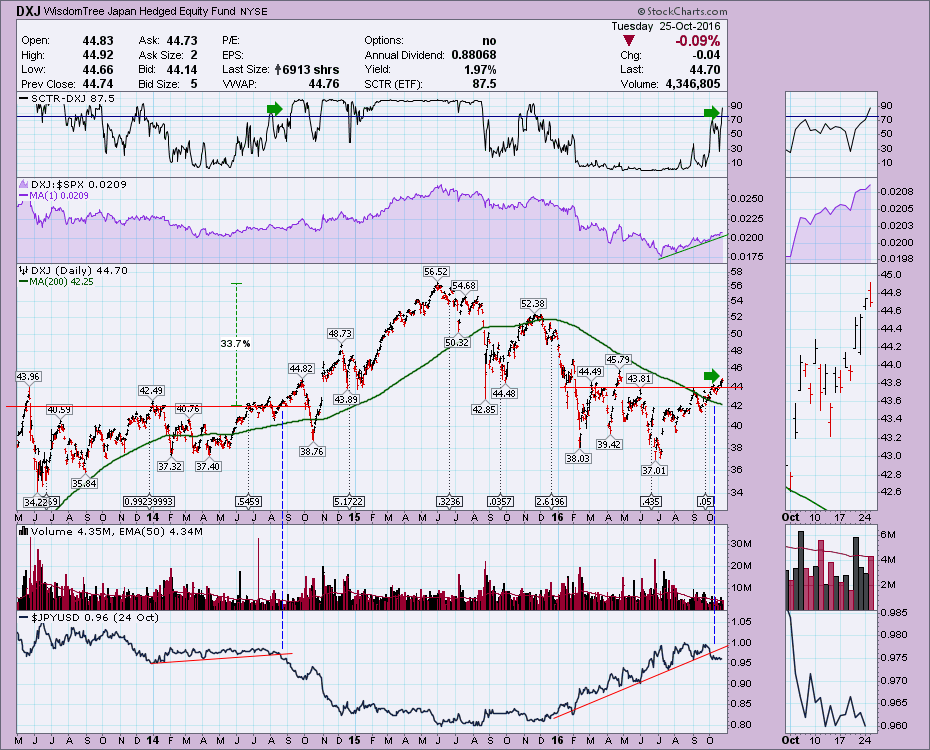
The Japanese $NIKK has started to break out to the upside. However, the currency is dropping. For investors, we have seen this movie before. Using the ETF's that hedged the currency worked out much better for investors last time the Yen dropped and the $NIKK soared... Read More
Don't Ignore This Chart! October 24, 2016 at 05:41 PM
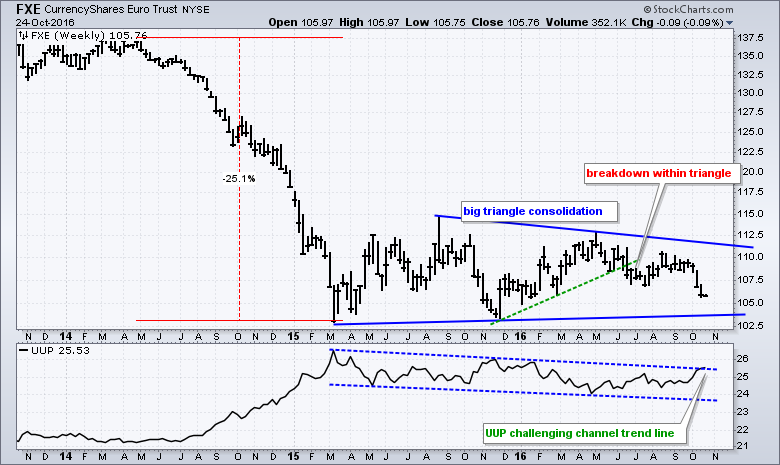
The Euro ETF (FXE) formed a large triangle after a sharp decline and this pattern could be just a big rest within a bigger downtrend. After falling some 25% in one year, FXE found support in March 2015 and moved sideways the last 20 months... Read More
Don't Ignore This Chart! October 22, 2016 at 12:48 PM
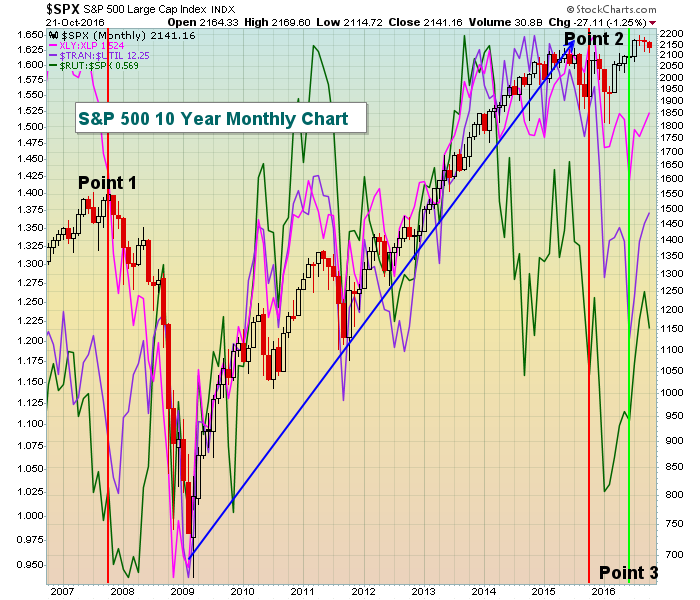
There are fundamental, technical and historical factors that drive U.S. equity prices. Earnings and interest rates have very clear fundamental impacts. The Fed has done everything in their power to keep interest rates at historically low levels in an attempt to promote growth... Read More
Don't Ignore This Chart! October 21, 2016 at 10:57 AM
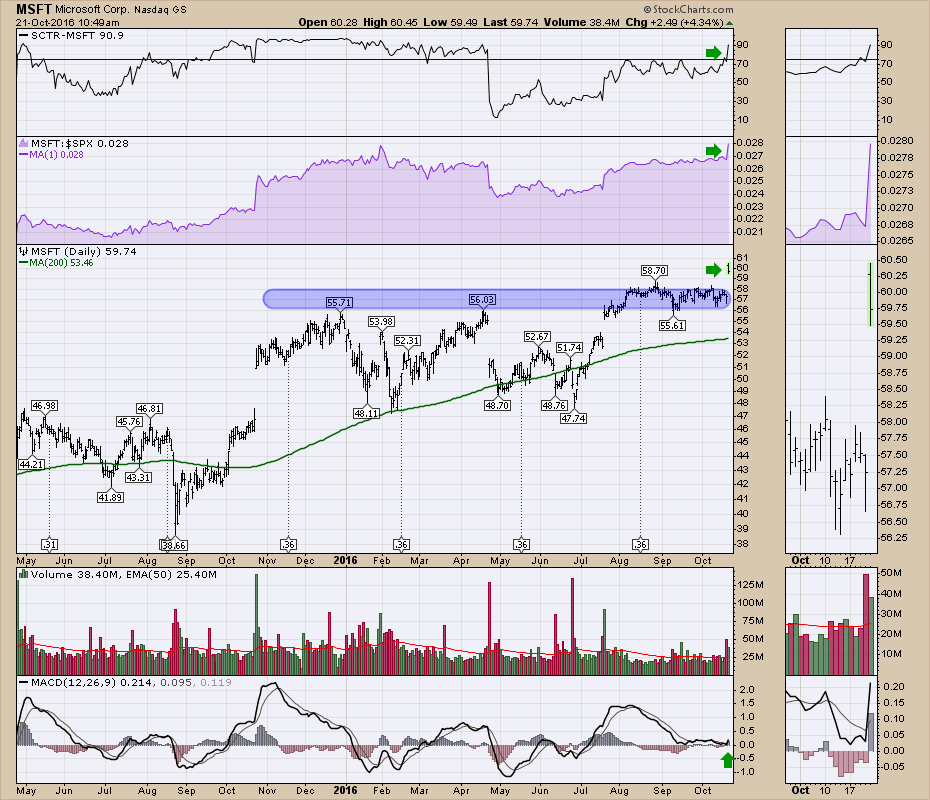
Recently, the market rally has been led predominantly by tech names. Microsoft (MSFT) added its name to the New Highs file today... Read More
Don't Ignore This Chart! October 20, 2016 at 11:36 AM
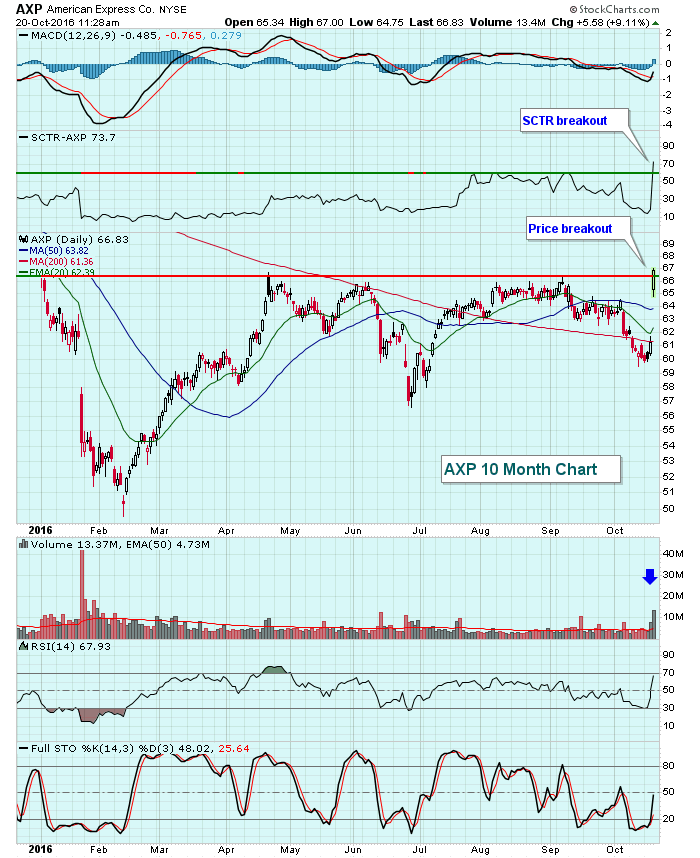
Wednesday, after the closing bell, American Express (AXP) posted quarterly results that blew away consensus estimates for EPS and also managed to top revenue estimates... Read More
Don't Ignore This Chart! October 19, 2016 at 11:03 AM
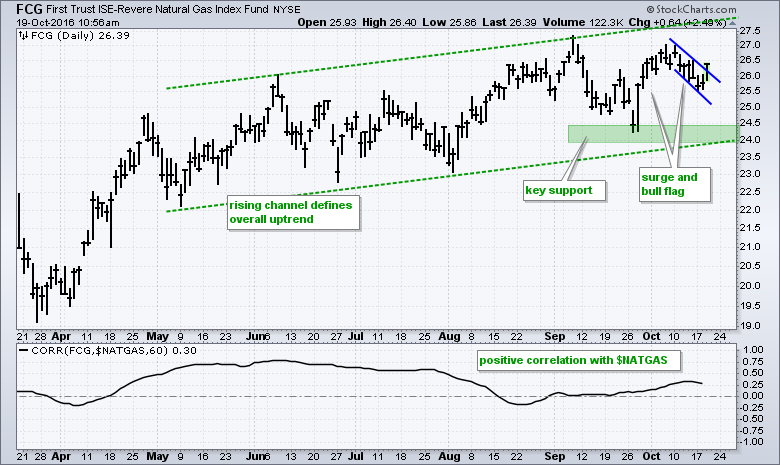
The FirstTrust Natural Gas ETF (FCG) has been one of the top performing ETFs this year with a year-to-date gain of around 18%. As the chart below shows, the overall trend is clearly up and the ETF is forming a small bullish continuation pattern... Read More
Don't Ignore This Chart! October 18, 2016 at 06:51 PM
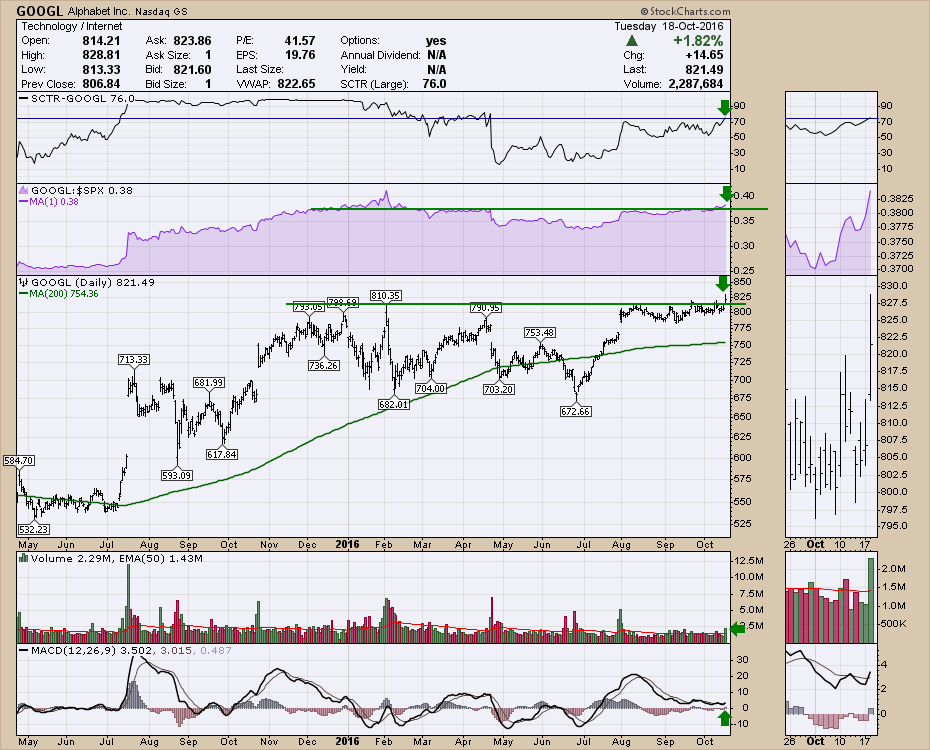
Alphabet (GOOGL) broke out above resistance to a new 52 week high and a new all time high today. The SCTR has been gently climbing and pushed above 75 today. The Relative Strength is breaking out to new 8 month highs... Read More
Don't Ignore This Chart! October 17, 2016 at 11:21 AM
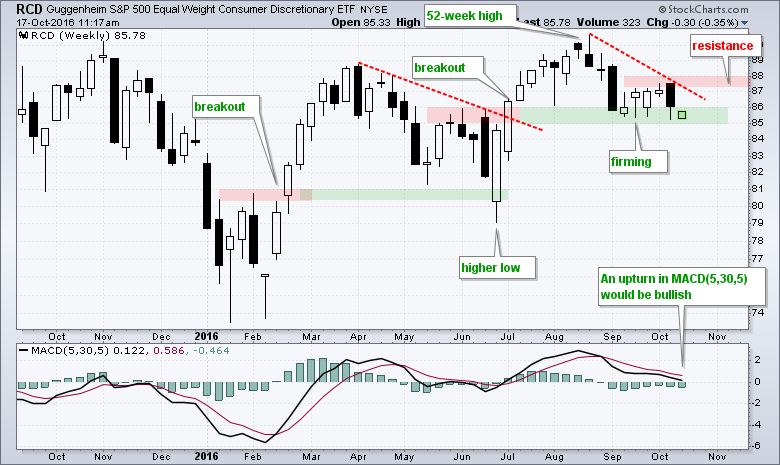
The consumer discretionary sector is one of the weakest performing sectors over the last six months, but the overall chart looks constructive and I am watching the October highs for a breakout... Read More
Don't Ignore This Chart! October 15, 2016 at 02:13 PM
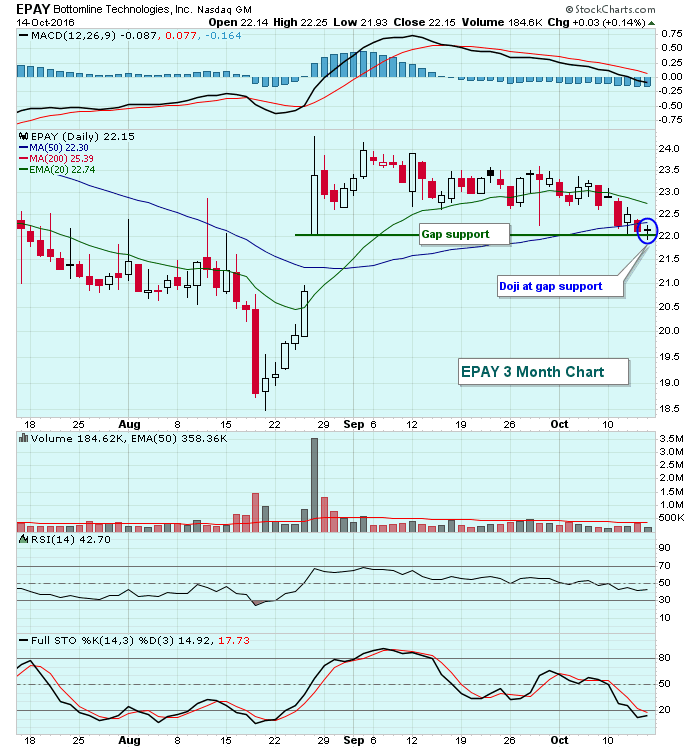
About seven weeks ago, Bottomline Technologies (EPAY) produced excellent quarterly earnings results when its top line edged Wall Street consensus estimates and its bottom line crushed them... Read More
Don't Ignore This Chart! October 14, 2016 at 12:49 PM
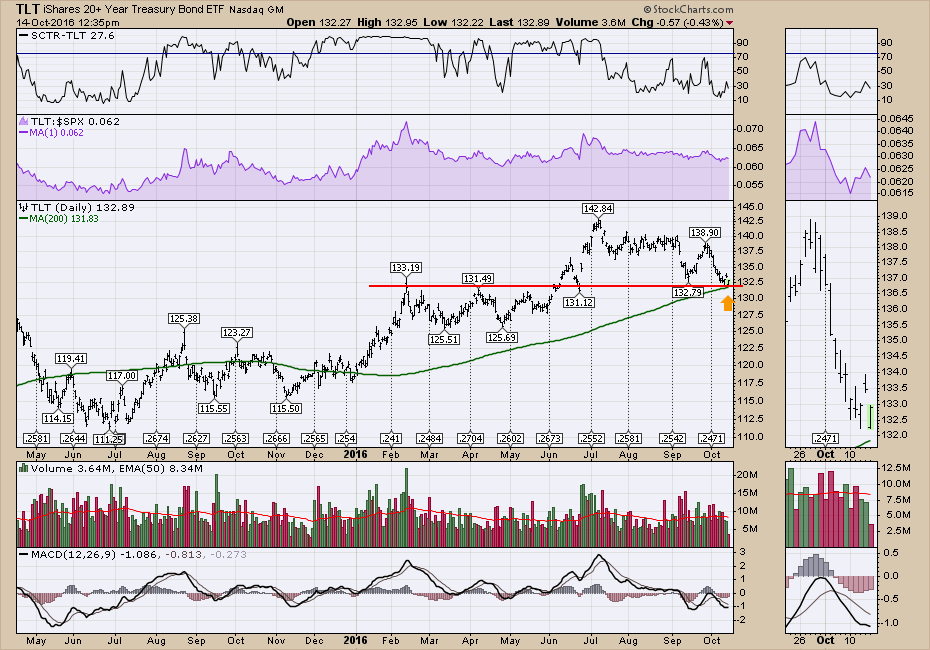
The bond market has been selling off considerably. Now the TLT is sitting at horizontal support and touching the 200 MA. This is an important place to expect support for a trade to the long side. The risk / reward ratio can be very good by having a stop just under these levels... Read More
Don't Ignore This Chart! October 13, 2016 at 12:08 PM
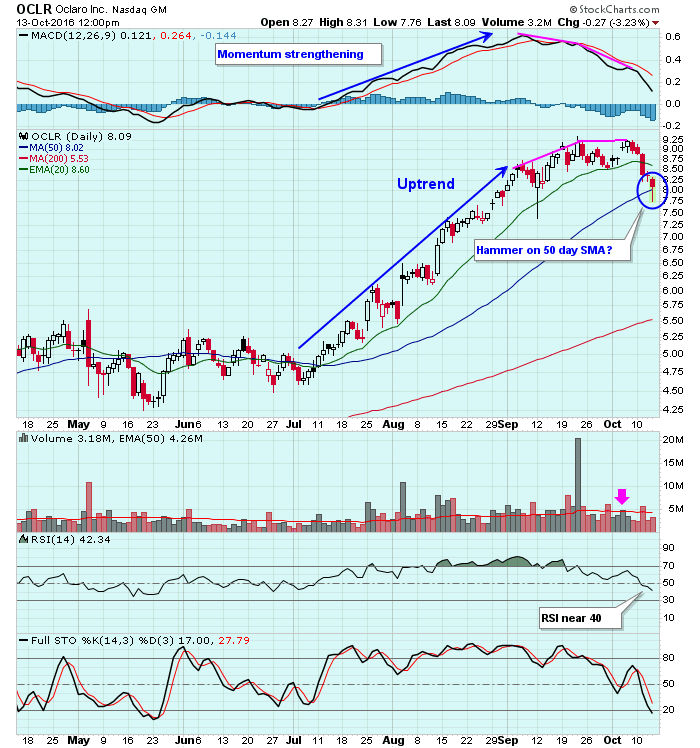
My favorite indicator, other than the combination of price and volume, is definitely the MACD. I've studied it for years and I use it as a very important momentum indicator in my trading strategy... Read More
Don't Ignore This Chart! October 12, 2016 at 12:13 PM
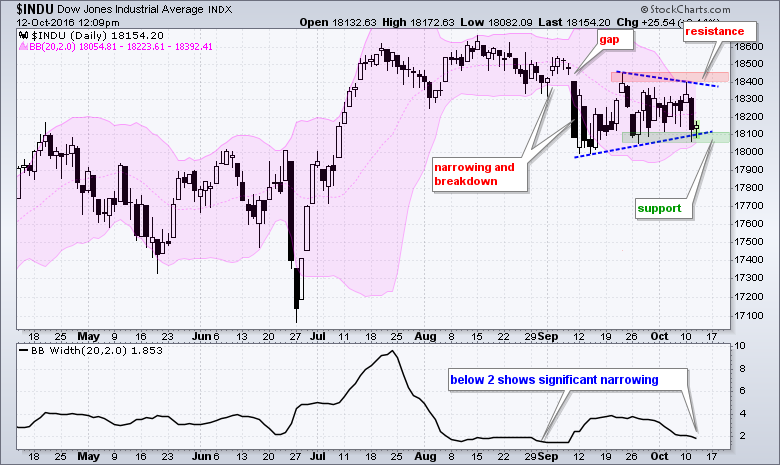
The Dow Industrials remains locked in a trading range since the 11-Sept breakdown and chartists should watch this range for the next directional clue. The chart shows the Bollinger Bands in pink and the indicator window shows BandWidth... Read More
Don't Ignore This Chart! October 11, 2016 at 03:15 PM
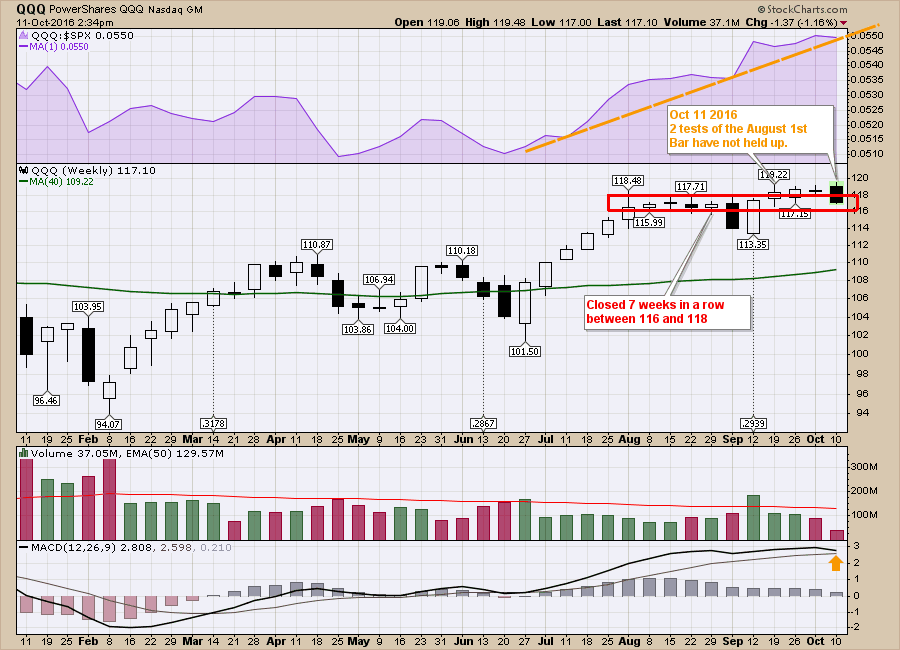
I don't talk about the technology stocks a lot as Arthur and Tom do a great job of zeroing in on them. This week seems like a good week to change it up a little... Read More
Don't Ignore This Chart! October 10, 2016 at 11:43 AM
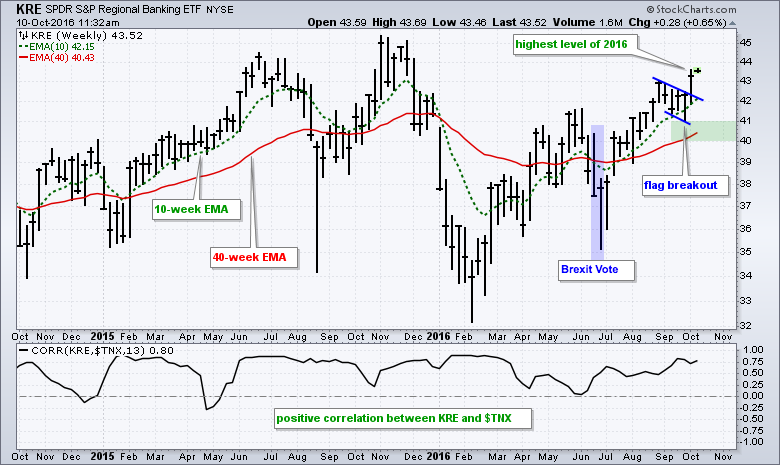
The rise in Treasury yields and bullish fourth quarter provide a strong tail-wind for banking stocks as we head into year-end... Read More
Don't Ignore This Chart! October 08, 2016 at 10:09 PM
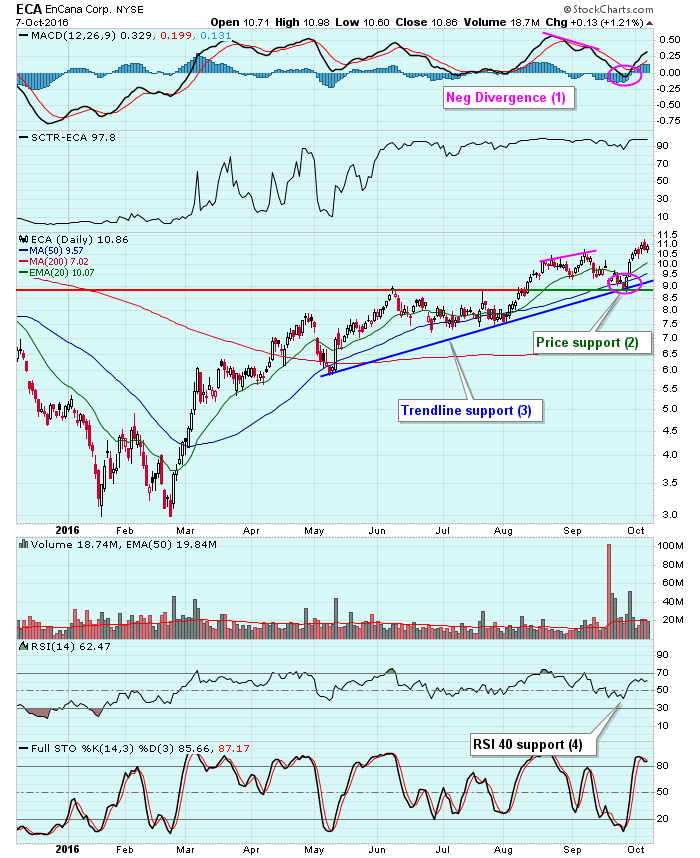
There is no such thing as a guarantee when it comes to stock trading. However, using technical analysis as a predictive tool to manage your risk is the key to success in my opinion. Let's take EnCana Corp (ECA) as an example... Read More
Don't Ignore This Chart! October 07, 2016 at 12:56 PM

Natural Gas is breaking out of a 4-month consolidation! Photo: 660-news.com The breakout is really important for traders. However, Natural Gas (UNG) swings wildly... Read More
Don't Ignore This Chart! October 06, 2016 at 12:28 PM
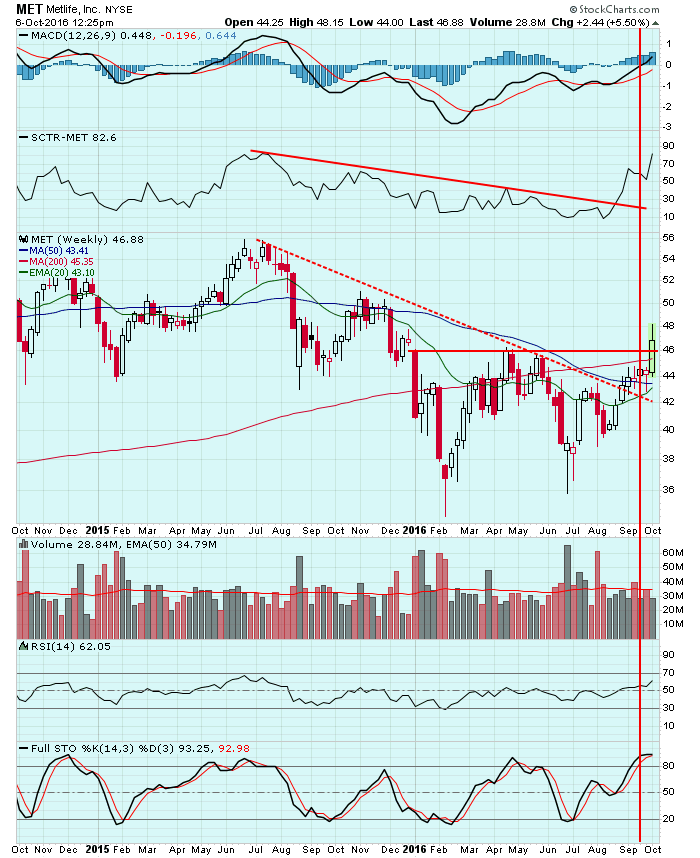
The Dow Jones U.S. Life Insurance index ($DJUSIL) broke above 650 for the first time in 2016, buoyed by suddenly surging 10 year treasury yields ($TNX). Leading the charge in the group is MetLife (MET), which at today's high had gained 33% since its post-Brexit low near 36.00... Read More
Don't Ignore This Chart! October 05, 2016 at 11:30 AM
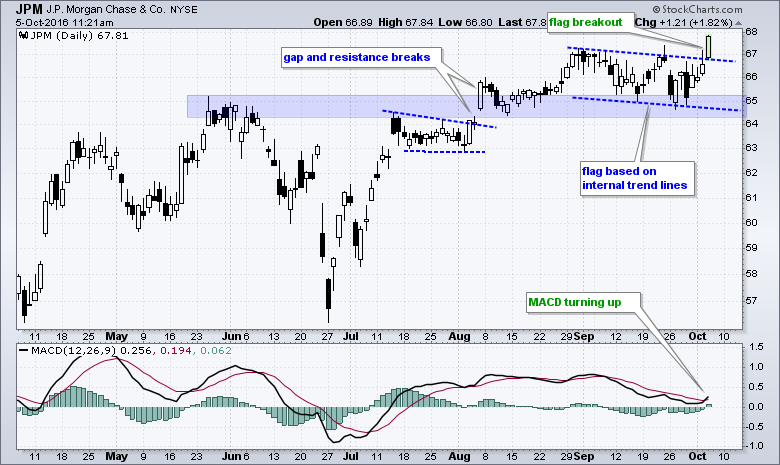
Banking stocks are leading the market on Wednesday and JP Morgan is leading the sector as one of the first of the big banks to hit a new high. I featured the Regional Bank SPDR (KRE) and the Bank SPDR (KBE) in ChartWatchers this weekend and JPM has the same chart pattern working... Read More
Don't Ignore This Chart! October 03, 2016 at 05:58 AM
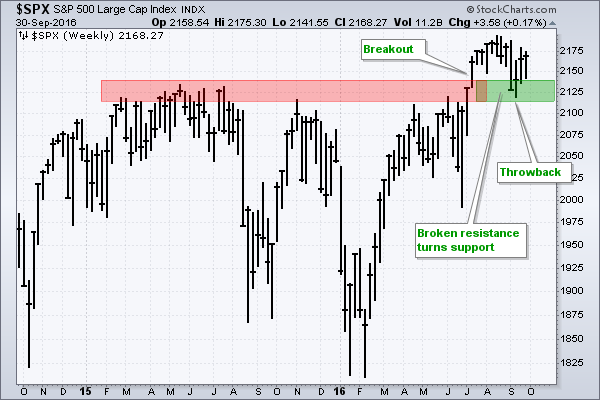
The S&P 500 broke above a big resistance zone with the July surge and this breakout should be considered bullish until proven otherwise. Classic technical analysis teaches us that broken resistance turns into the first support level and this is exactly what happened in September... Read More
Don't Ignore This Chart! October 01, 2016 at 05:54 PM
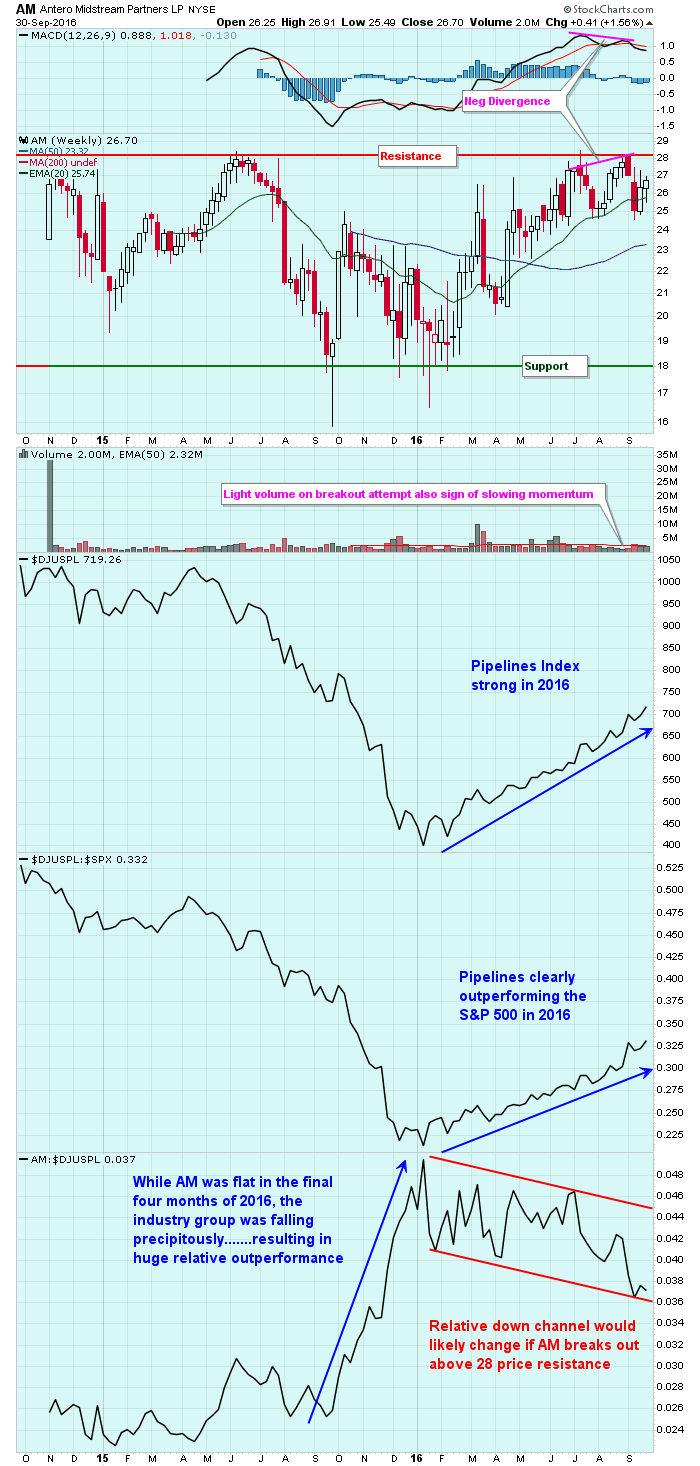
On a weekly closing basis, Antero Midstream Partners LP (AM) has vacillated between support near 18.00 and resistance at 28.00 for the past two years. While the Dow Jones U.S... Read More