Don't Ignore This Chart! January 31, 2017 at 04:34 PM
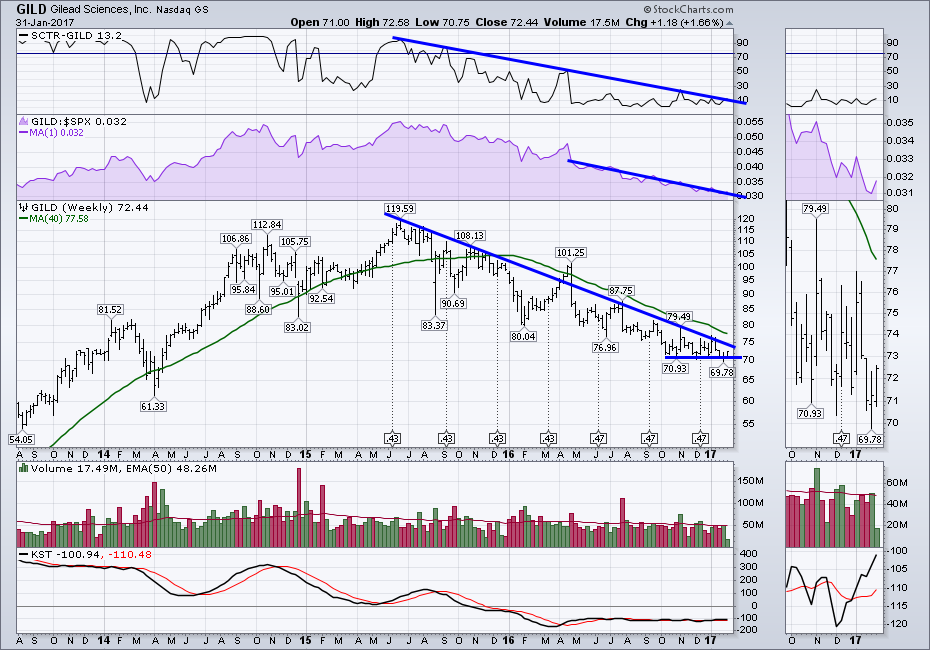
Gilead (GILD) has an interesting chart setup this week. Gilead has been bouncing while the US markets have had their worst two day stretch in a while. So let's define the chart setup and the risks. In early December, Gilead tested below $71. The next week it rallied almost 8%... Read More
Don't Ignore This Chart! January 30, 2017 at 02:17 PM
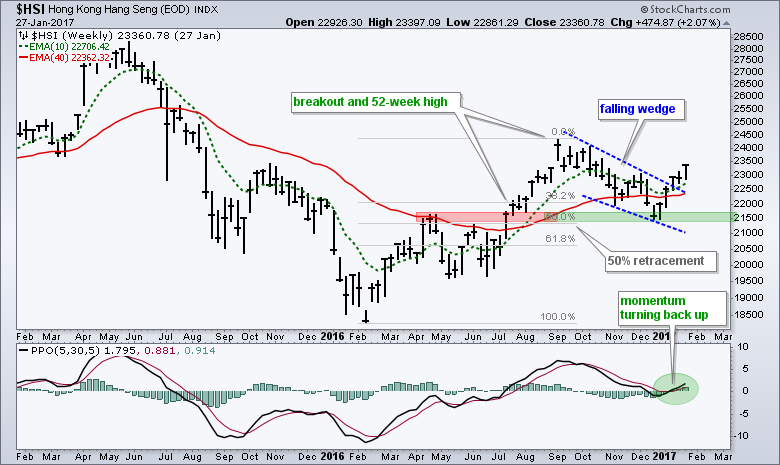
The Hang Seng Composite ($HSI) is having a good year with a 6% gain year-to-date. The weekly chart also looks bullish because the big trend is up and a correction just ended. First, the index broke resistance with a sharp advance from late June to early September... Read More
Don't Ignore This Chart! January 29, 2017 at 10:54 PM
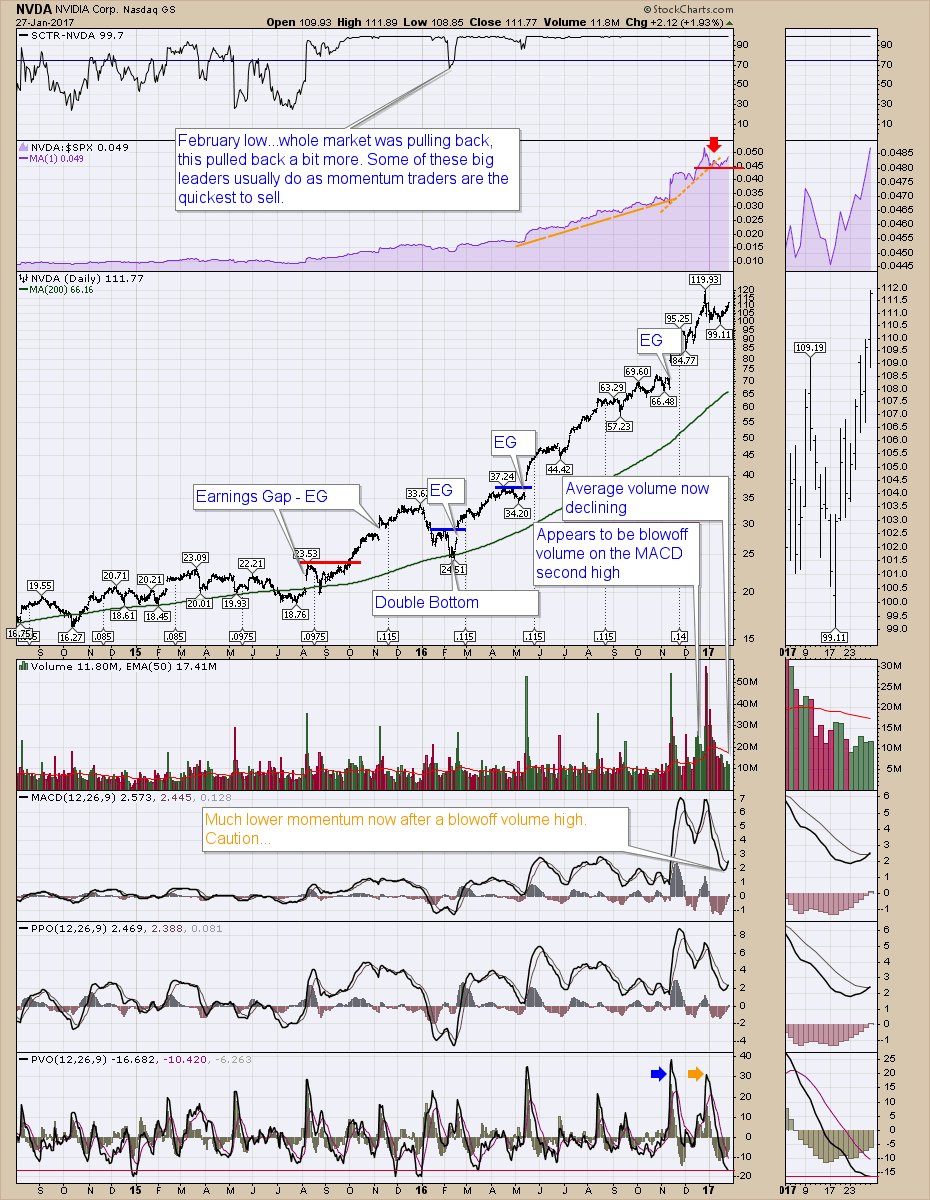
I can be as wrong as the next guy when it comes to Bullish, Cautionary or Bearish, so I’ll lay out my thoughts and you can ponder them, discard them, laugh at them, whatever you choose. I do not own NVDA, so its a lot easier for me to say the interim top is close at hand... Read More
Don't Ignore This Chart! January 26, 2017 at 11:40 AM
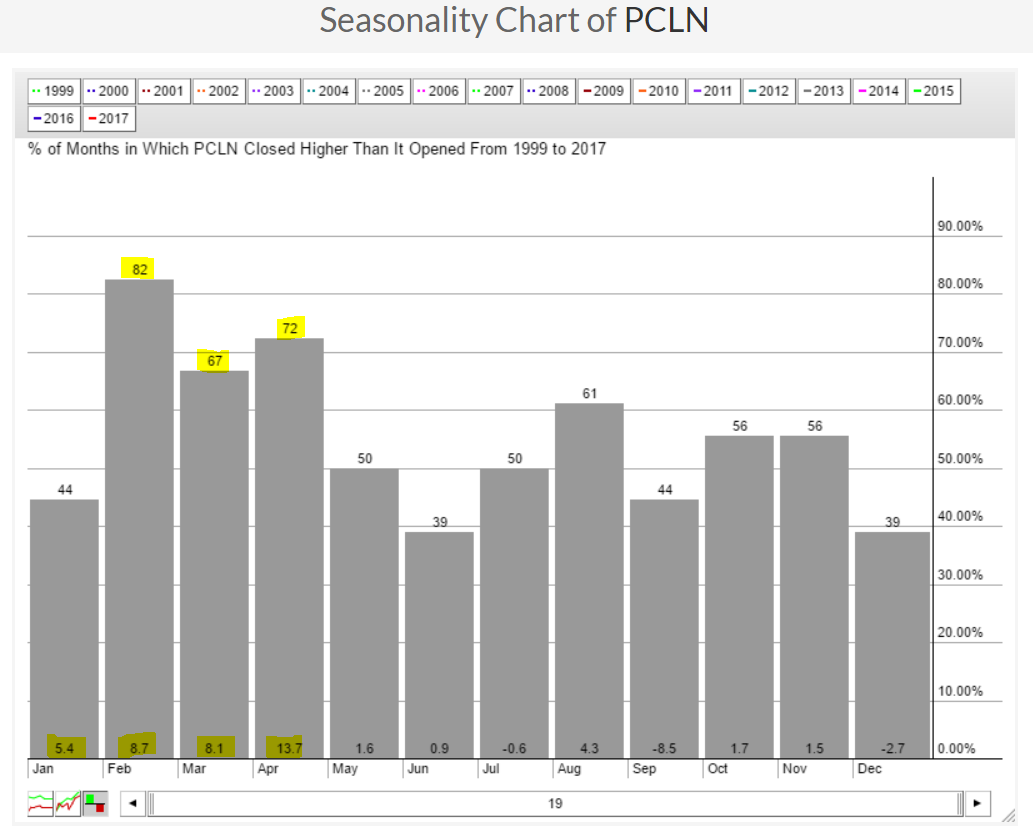
I am always aware of typical historical strength that lies ahead. Along those lines, it's important to note that the Dow Jones U.S. Travel & Tourism Index ($DJUSTT) has been the fourth best industry group in terms of February performance. priceline... Read More
Don't Ignore This Chart! January 25, 2017 at 11:05 AM
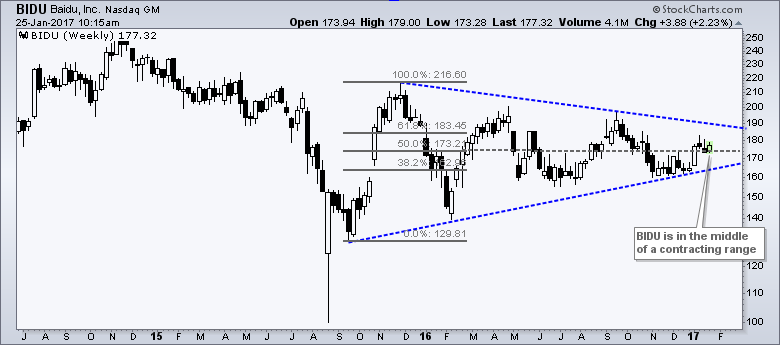
Baidu (BIDU) has gone nowhere for a year as a large triangle pattern formed on the weekly chart. There are, however, signs of support and a short-term bullish pattern is emerging on the daily chart... Read More
Don't Ignore This Chart! January 24, 2017 at 01:04 PM
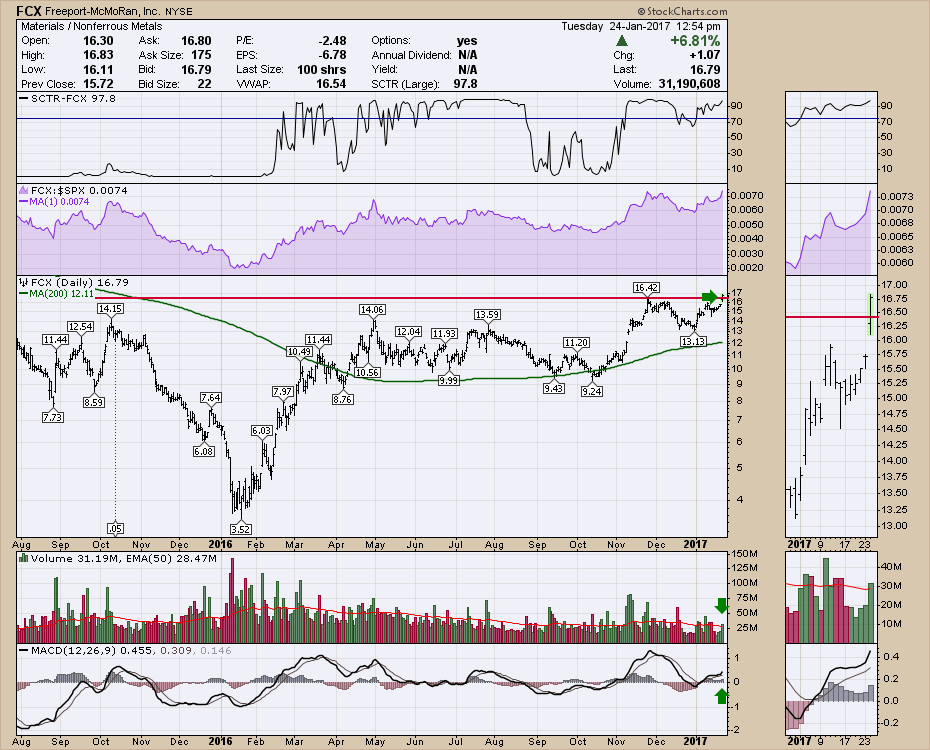
Freeport McMoran (FCX) is jumping to new highs today on the back of renewed interest in Copper and Gold. This is an excellent entry for breakout buyers. The MACD is just turning up again above zerom the volume on today's breakout is above average and the SCTR is at 97... Read More
Don't Ignore This Chart! January 23, 2017 at 04:19 PM
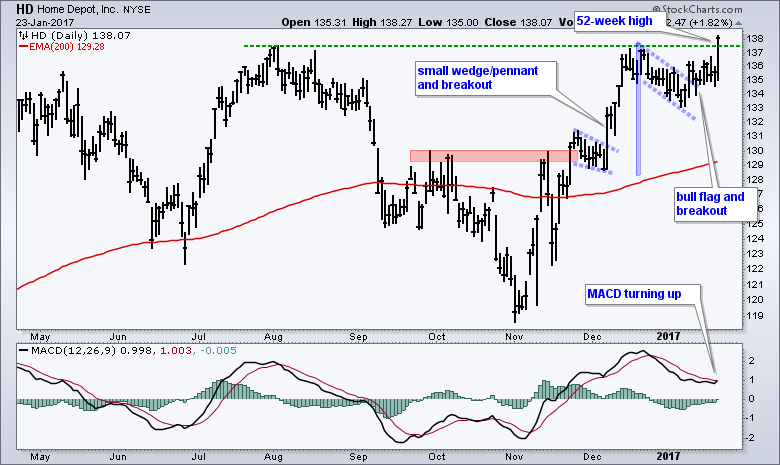
In what could be a good sign for housing and the economy, Home Depot (HD) exceeded its summer highs and hit a 52-week high. Home Depot is an interesting company because can be considered part of the housing industry and the retail industry... Read More
Don't Ignore This Chart! January 22, 2017 at 01:58 PM
My favorite kind of stocks are those that advance and then base for an extended period of time before breaking out. The consolidation period rids the stock of weak holders, providing a much better foundation for a sustainable rally... Read More
Don't Ignore This Chart! January 19, 2017 at 11:38 PM
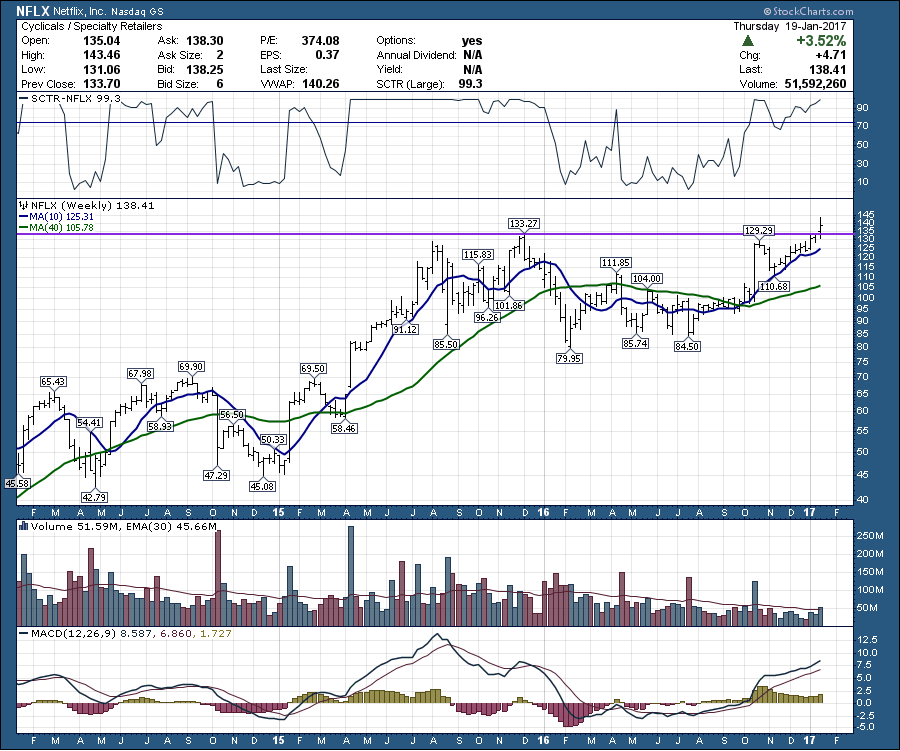
Netflix continues to deliver content to homes and profits to investors. After reporting good numbers vs. expectations, Netflix popped up to new highs. It wasn't all scrolling credits for the company as the stock sold off continuously on Thursday after the huge gap to new highs... Read More
Don't Ignore This Chart! January 19, 2017 at 04:07 PM
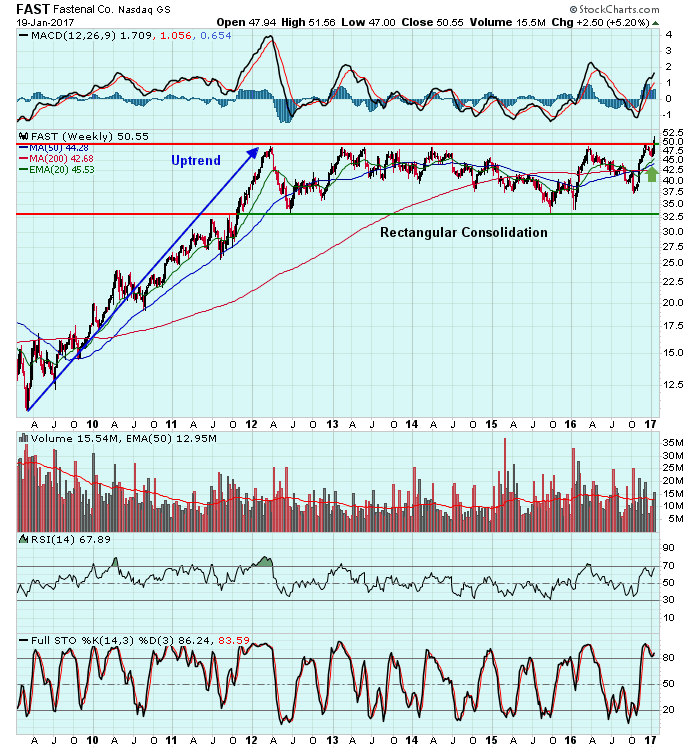
I wrote about Fastenal (FAST) in this blog just two weeks ago. This is a stock that had been in a sideways consolidation pattern for many years after a prior uptrend. So I was looking for the next breakout... Read More
Don't Ignore This Chart! January 18, 2017 at 12:03 PM
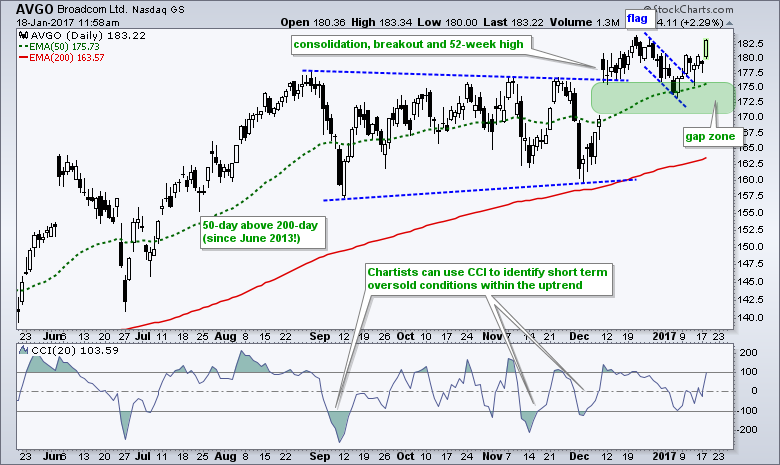
BroadCom (AVGO) is showing upside leadership again with a flag breakout last week and a 2% surge today. Overall, the stock advanced to a 52-week high in August and then embarked on a long consolidation... Read More
Don't Ignore This Chart! January 18, 2017 at 01:50 AM
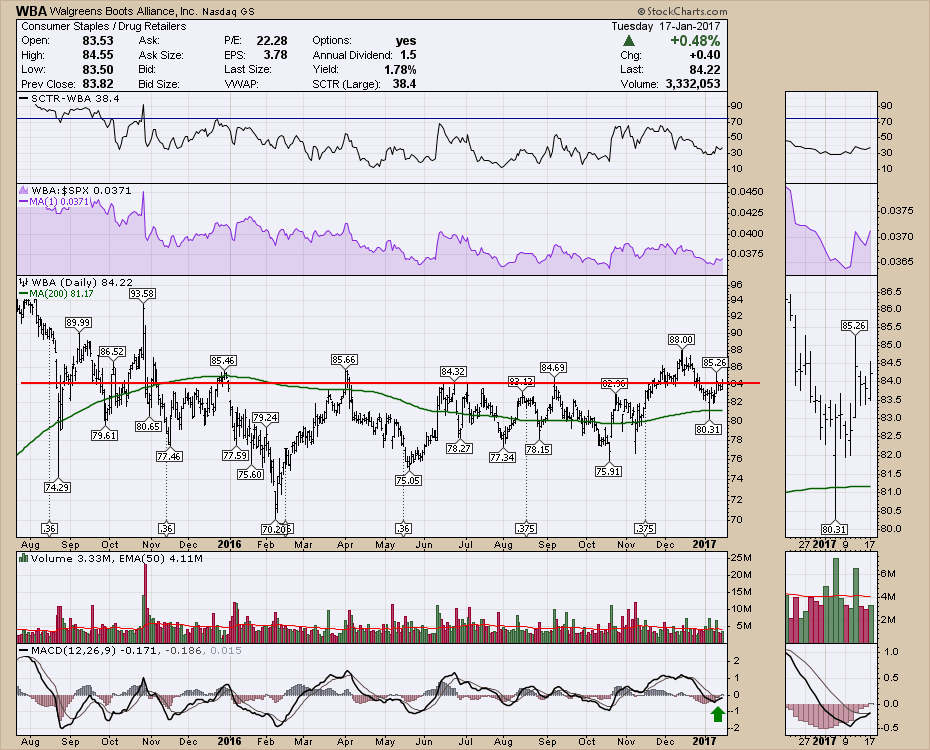
Walgreens Boots Alliance (WBA) has recently pushed above a breakout level and then pulled back to retest. Today, the stock looks ready to breakout above the previous resistance shown in red again. Thinks looks like an important area to watch... Read More
Don't Ignore This Chart! January 16, 2017 at 10:55 AM
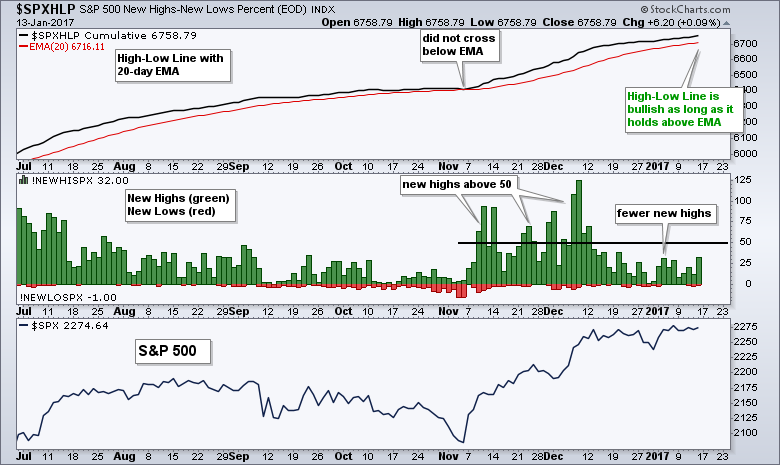
The chart below shows the High-Low Line for the S&P 500, new highs/lows as a histogram, and the S&P 500. Notice that new highs exceeded 50 several times from mid November to mid December... Read More
Don't Ignore This Chart! January 15, 2017 at 04:19 PM
Banks threatened another breakout on Friday before stalling and dropping after an early morning surge higher. Bank of America (BAC) credited higher interest rates for its earnings beat Friday morning and said it was anticipating significantly higher net interest margins in 2017... Read More
Don't Ignore This Chart! January 13, 2017 at 03:08 PM
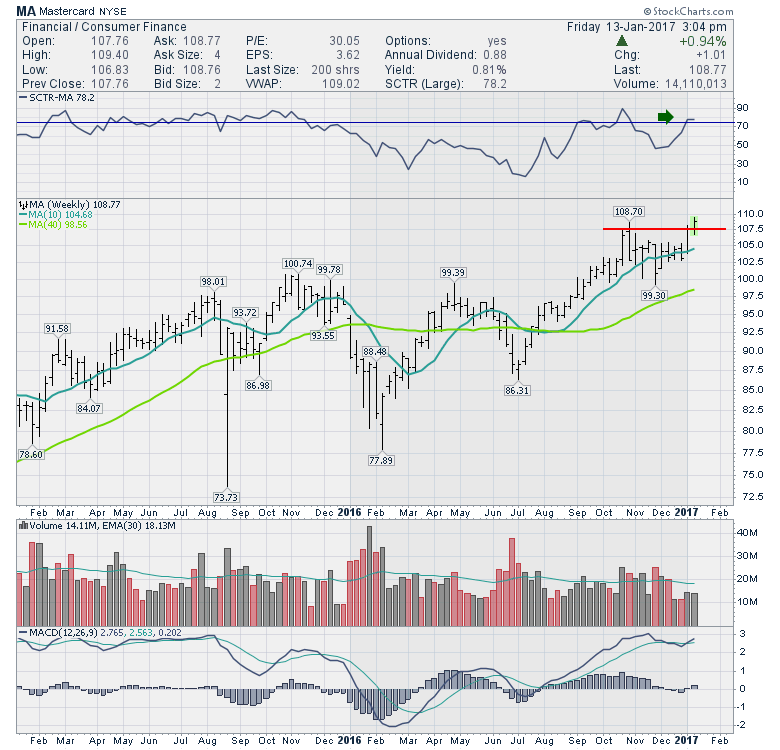
Mastercard (MA) does not seem to be impaired with the slowdown in the retail stocks. This chart is bottom left to top right! Today, Mastercard pushed to new highs and at time of writing was just off the highs... Read More
Don't Ignore This Chart! January 12, 2017 at 01:56 PM
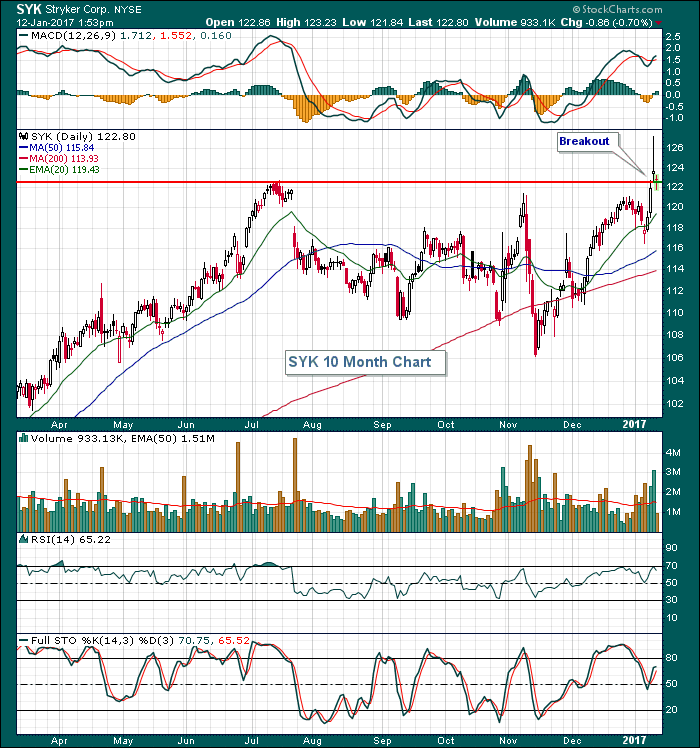
Stryker Corporation (SYK), a medical technology company, preliminarily reported their latest quarterly results and indicated they'd be ahead of expectations. That announcement resulted in a gap up and breakout above previous price resistance on Wednesday... Read More
Don't Ignore This Chart! January 11, 2017 at 09:00 AM
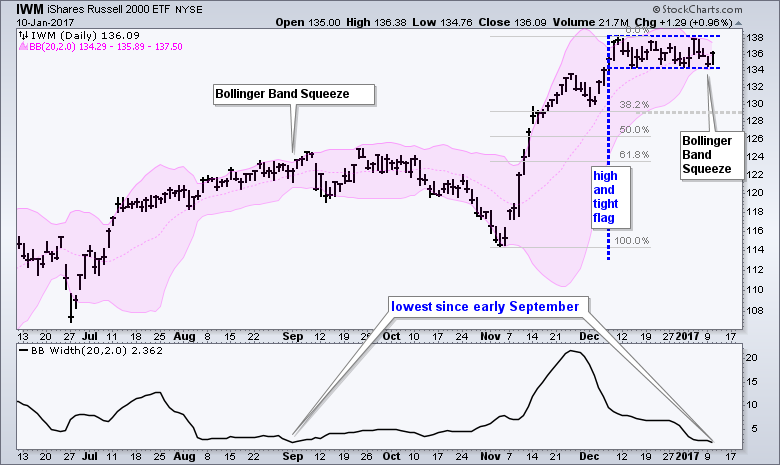
After a big surge from early November to early December, the Russell 2000 iShares (IWM) moved into a tight trading range the last four weeks. Chartists should watch the resolution of this trading range for the next directional clue... Read More
Don't Ignore This Chart! January 10, 2017 at 06:26 PM
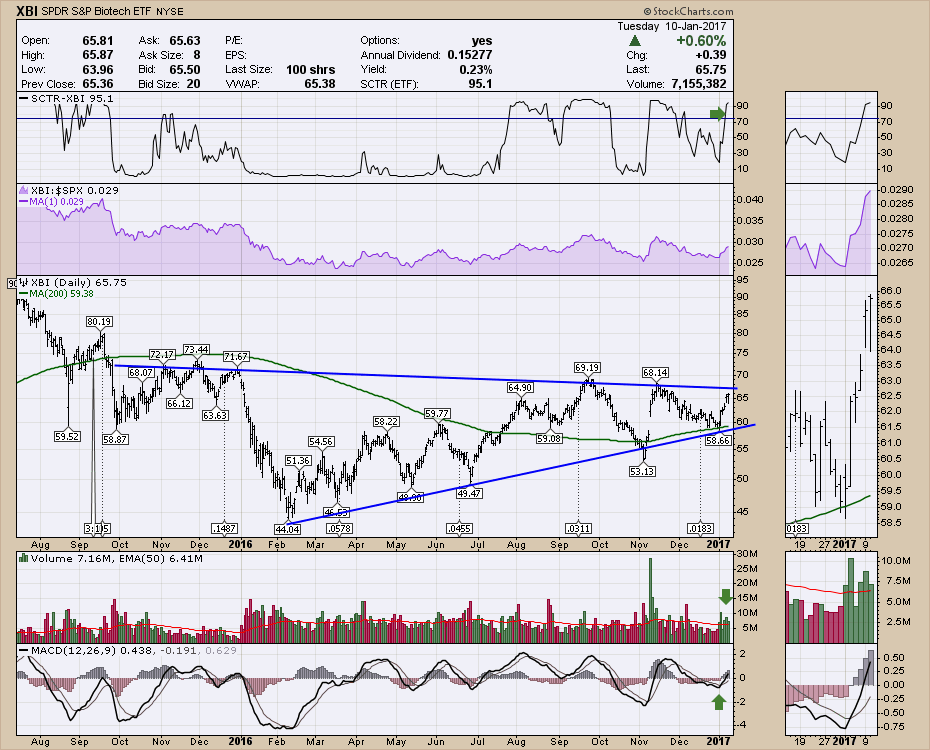
XBI, IBB, SBIO and numerous other Biotech ETF's have surged the first few days of the new year. They all look set to breakout so you might want to tune your eyes into the area for at least a few interesting charts... Read More
Don't Ignore This Chart! January 09, 2017 at 11:55 AM
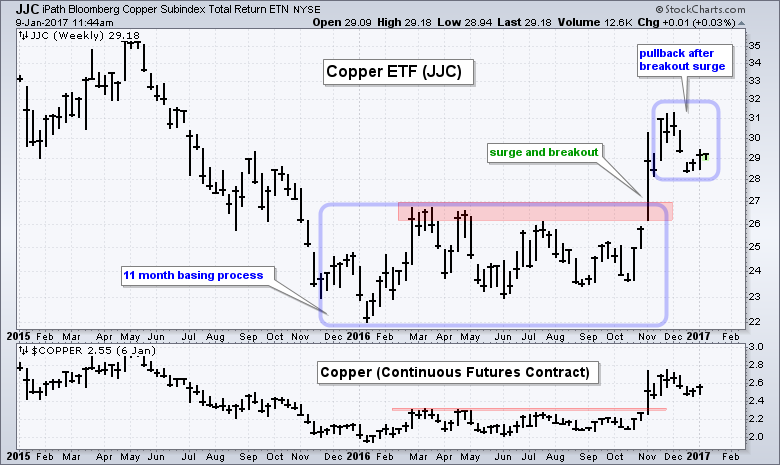
The Copper ETN (JJC) broke out with a big surge in October-November and then pulled back in December. This pullback looks like a normal correction after a big move and chartists should be alert for a continuation higher... Read More
Don't Ignore This Chart! January 05, 2017 at 09:41 PM
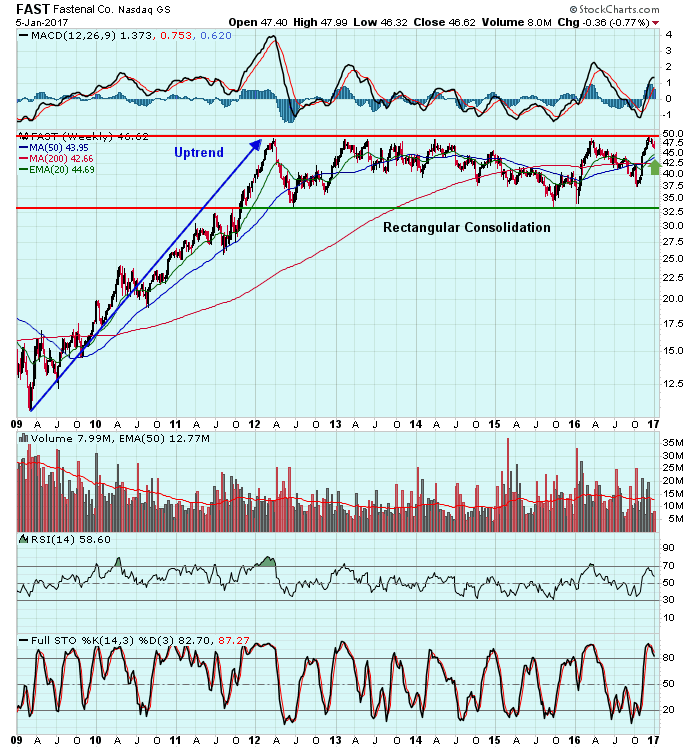
Since the beginning of 2012, Fastenal Co. (FAST) has tested its 48-49 price resistance zone on seven different occasions - most recently four weeks ago - without any success... Read More
Don't Ignore This Chart! January 04, 2017 at 01:53 PM
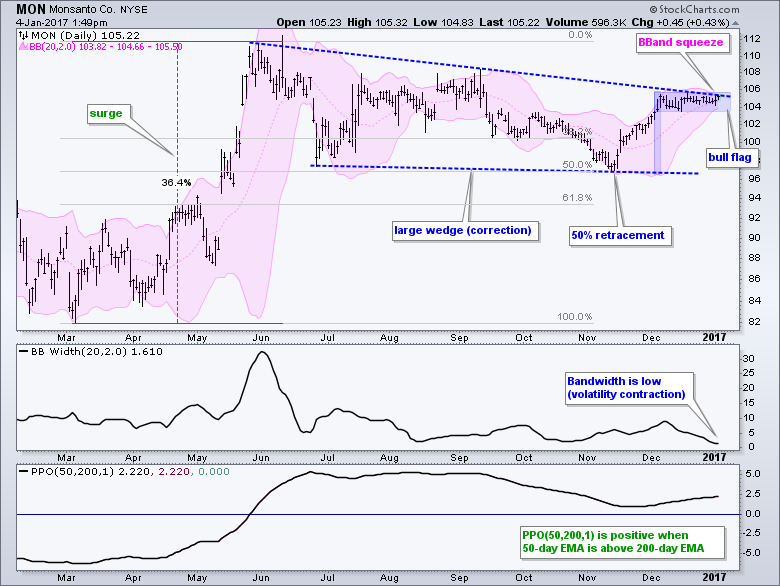
Monsanto (MON) is in the midst of a tight consolidation and the resolution of this consolidation could trigger a big breakout. Let's first start with the bigger picture. MON surged 36.4% from March to June and then corrected with a large wedge... Read More
Don't Ignore This Chart! January 02, 2017 at 06:18 PM
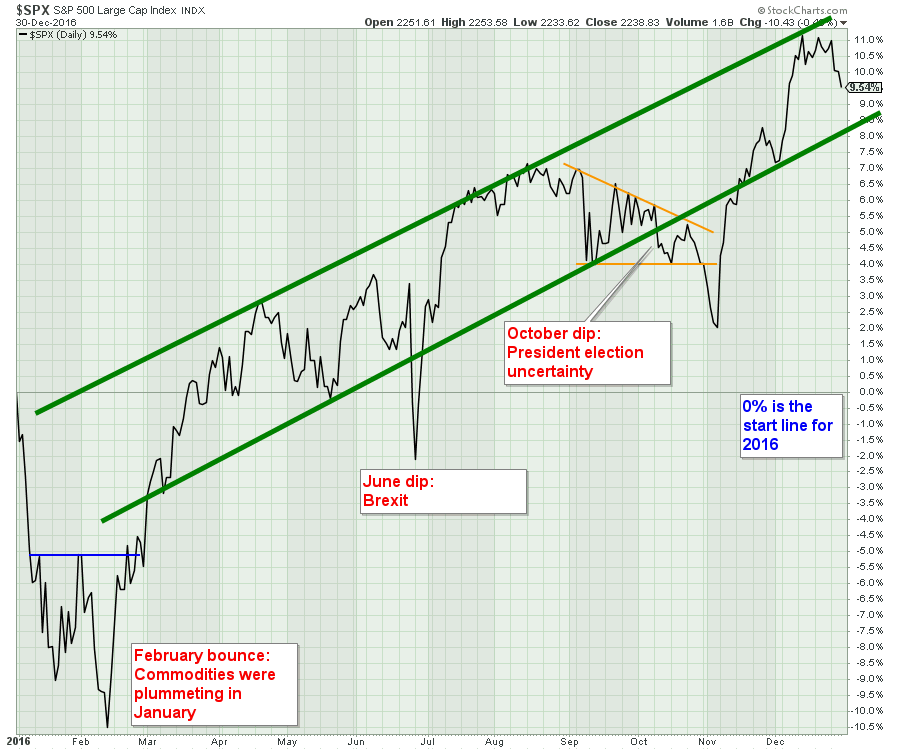
This is the final installment of 2016 In Review. The first three are: 2016 In Review - Commodities 2016 In Review - Currencies 2016 In Review - Bonds There were lots of wide swings in the 2016 market as always. With a plunderous start, January had the equities selling off... Read More
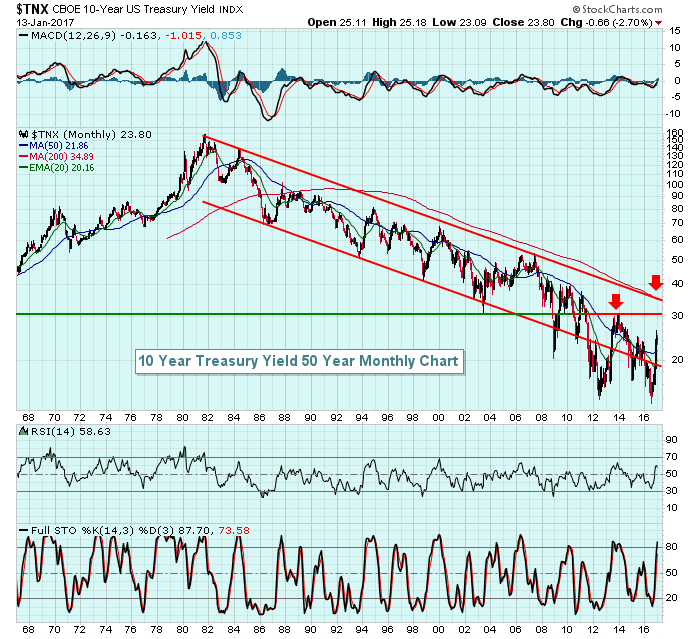
Don't Ignore This Chart! January 02, 2017 at 01:58 AM
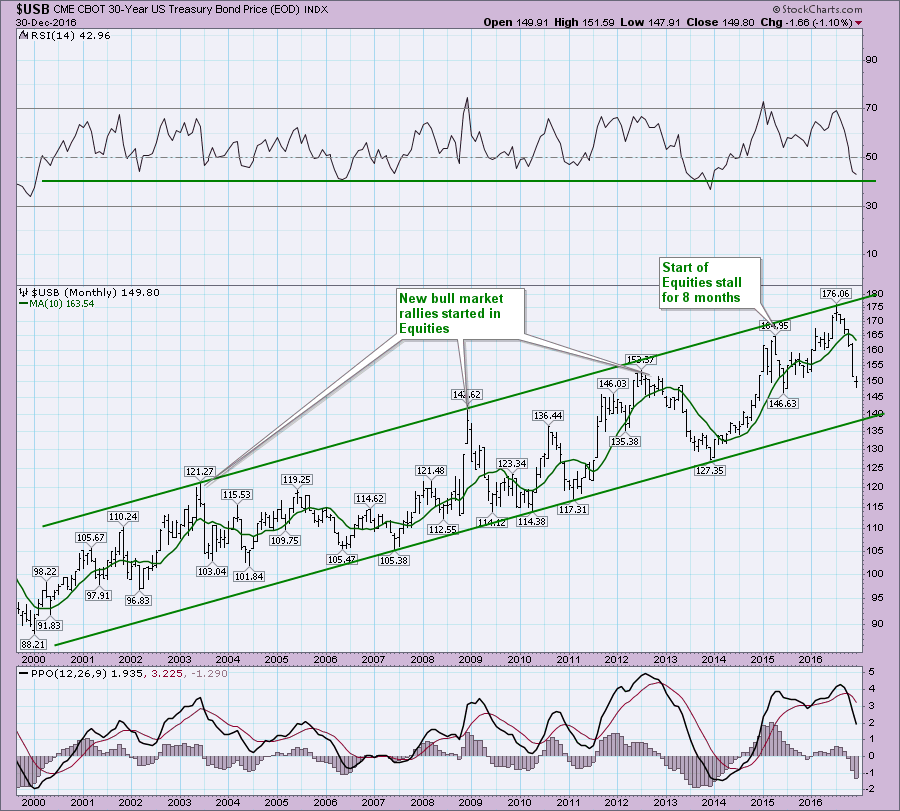
When everybody loves a bond to everyone hates a bond all within 6 months, it makes it hard for average investors to have any confidence in the stability of the market. That emotional roller coaster showed up in the bond market again this year... Read More
Don't Ignore This Chart! January 01, 2017 at 03:24 PM
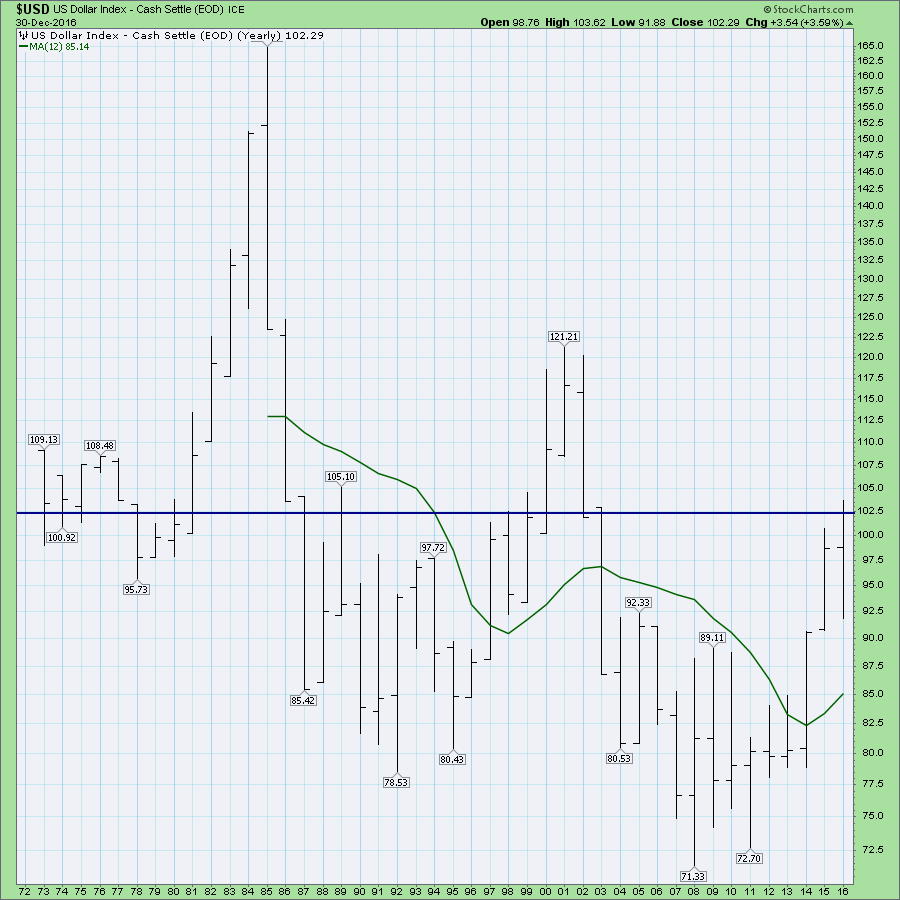
Continuing on our review of 2016, we move to currencies. We can look at the $USD using annual bars as the data goes back to 1973. The US Dollar is almost back to where the close was in 1973. The blue line is our current level... Read More
Don't Ignore This Chart! January 01, 2017 at 11:16 AM
Technology stocks (XLK) have shown signs of slowing momentum via lower weekly MACD readings while prices have moved higher... Read More