The chart below shows the High-Low Line for the S&P 500, new highs/lows as a histogram, and the S&P 500. Notice that new highs exceeded 50 several times from mid November to mid December. This showed good internal strength because over 10% of stocks in the S&P 500 were hitting new highs. New highs have since dwindled and did not surpass 50 since December 12th. This shows less strength within the index, but we have yet to see a serious expansion of new lows.
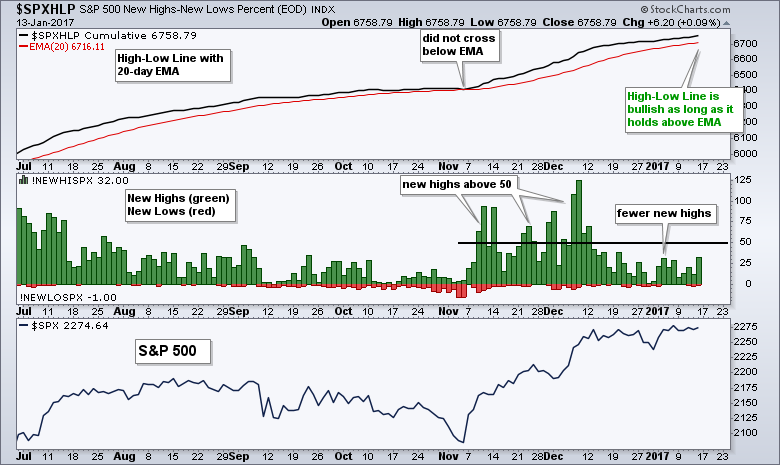
The top window shows the High-Low Line, which is a cumulative measure of Net New Highs (new highs less new lows). Notice how the indicator flattened into early November and almost crossed below the 20-day EMA (red line). This occurred as new highs dwindled and new lows started to increase. The increase, however, was not substantial enough to push the High-Low Line below its 20-day EMA. Chartists looking for signs of a downturn or correction in the S&P 500 can watch for a downturn and bearish moving average cross in the High-Low Line.
****************************************
Thanks for tuning in and have a great day!
--Arthur Hill CMT
Plan your Trade and Trade your Plan
*****************************************