The Hang Seng Composite ($HSI) is having a good year with a 6% gain year-to-date. The weekly chart also looks bullish because the big trend is up and a correction just ended. First, the index broke resistance with a sharp advance from late June to early September. Second, the index hit a 52-week high in early September. Third, the 10-week EMA moved above the 40-week EMA in early August.
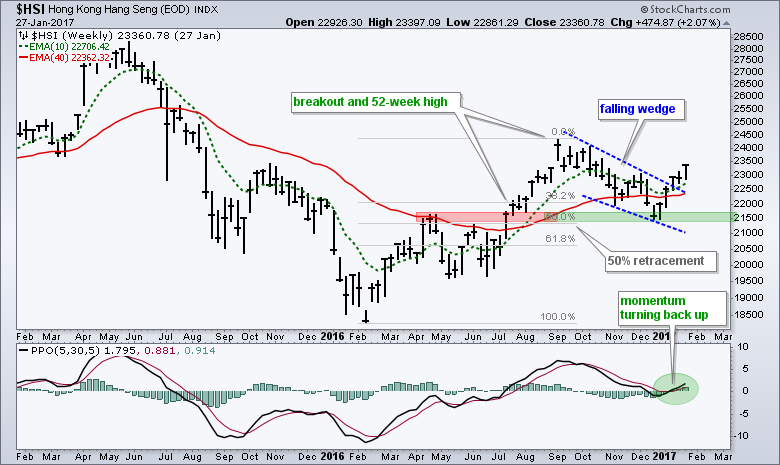
After hitting a 52-week high in early September, the index decline with a retracement and pattern that are typical for corrections. First, the falling wedge back to the 21500 area retraced half (50%) of the prior advance. This means the index moved two steps forward and one step backward. Second, the index formed a falling wedge, which is typical for a pullback within a bigger uptrend. The subsequent wedge breakout signals an end to this correction and a resumption of the bigger uptrend.
****************************************
Thanks for tuning in and have a great day!
--Arthur Hill CMT
Plan your Trade and Trade your Plan
****************************************