Bank of America (BAC) has been consolidating recently. Today that consolidation ended as BAC made a big bull push out of the consolidation pattern. With a strong SCTR, this was on the radar anyway. Click on this link to understand more about what the SCTR is. However, today BAC broke out to new highs in Relative Strength in purple, price broke to a new high and the volume was well above a high average. The MACD made a nice bullish cross after resetting down near zero. Nice.
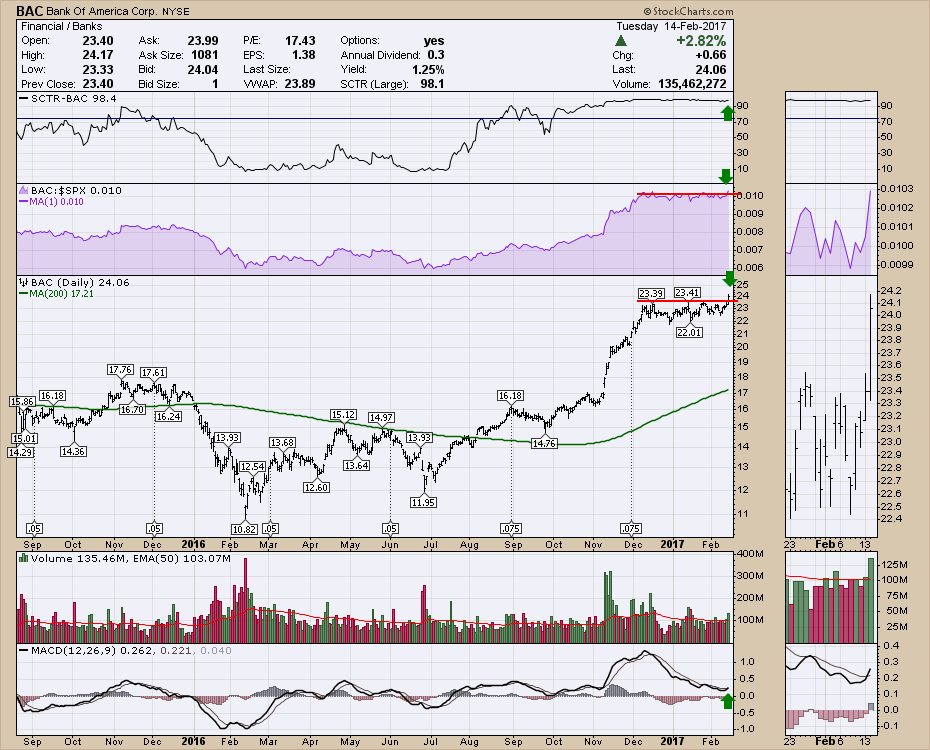
One of the stronger values for our membership is the SCTR ranking. It showed the BAC SCTR moving above 75 back in August. BAC price action continues to demonstrate relative market strength and is continually surging higher. How can you keep finding strong stocks? That's where the SCTR shows its power. See all the different ways we show the SCTR below as we try to point members to strong stocks.
As a member of StockCharts, you can scan to continually find the leadership stocks. If you don't like scanning, I think you'll agree the SCTR is a great way to stay on top of the market. If you are not employing the SCTR as part of your process, I would encourage you to take a look at it. Technical Analysis works on all stocks but trading weak stocks is more difficult. When you trade in strong stocks, you are much more likely to have the support of institutions who are also owning strong stocks. If you start with strong stocks and spend your time working with those stocks, you can enjoy the process of technical analysis. Working with weak stocks and trying to find breakouts is harder as the primary trend is lower.
Where can you find the SCTR information? It is all over the StockCharts.com website and is one of the many indicators we created for our members. To take a free trial click here.
Here are some locations where you can find the SCTR on StockCharts.com. This is one of the key features of StockCharts.com and could be integrated into your daily routine easily.
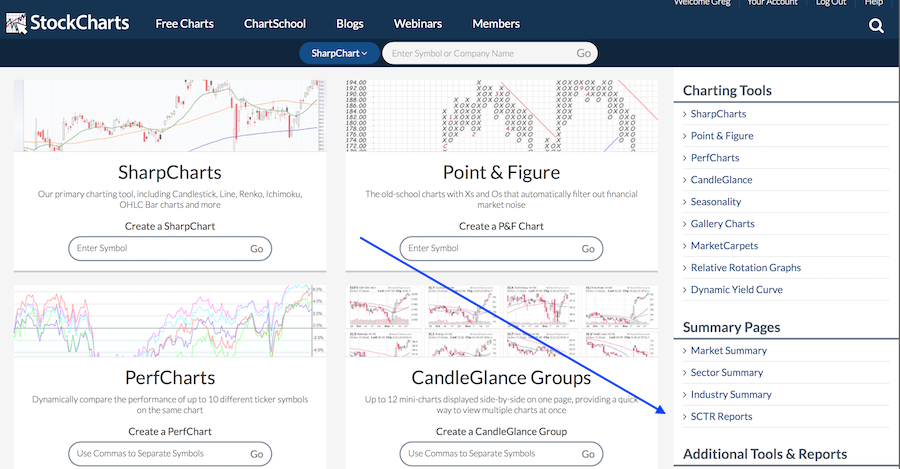
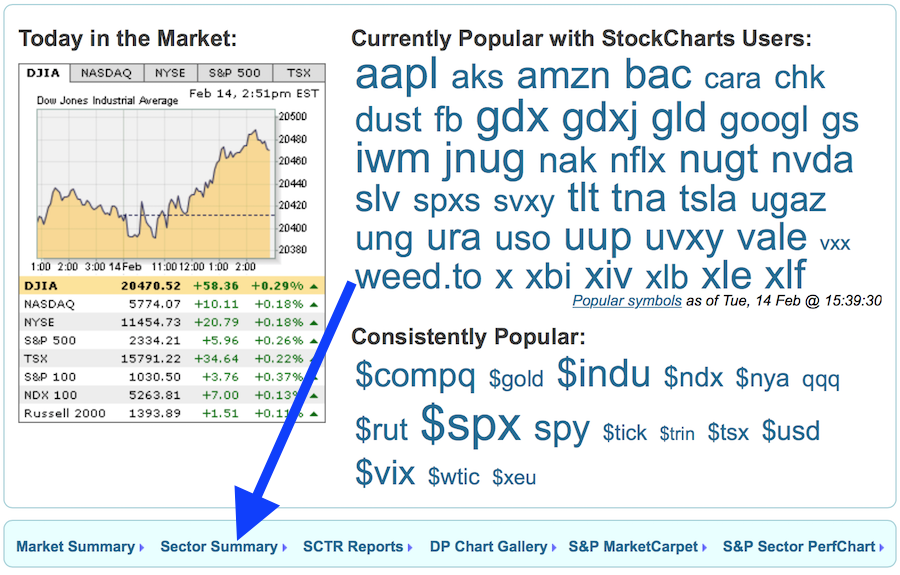
First of all, on the home page, there are multiple links. A large portion of the home page is dedicated to the SCTR. First of all, the main line through the middle of the page has many important links including the SCTR.
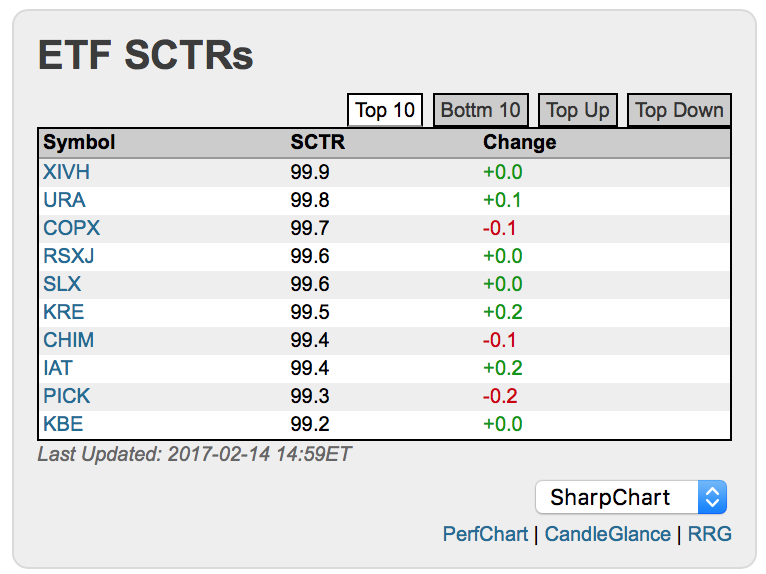
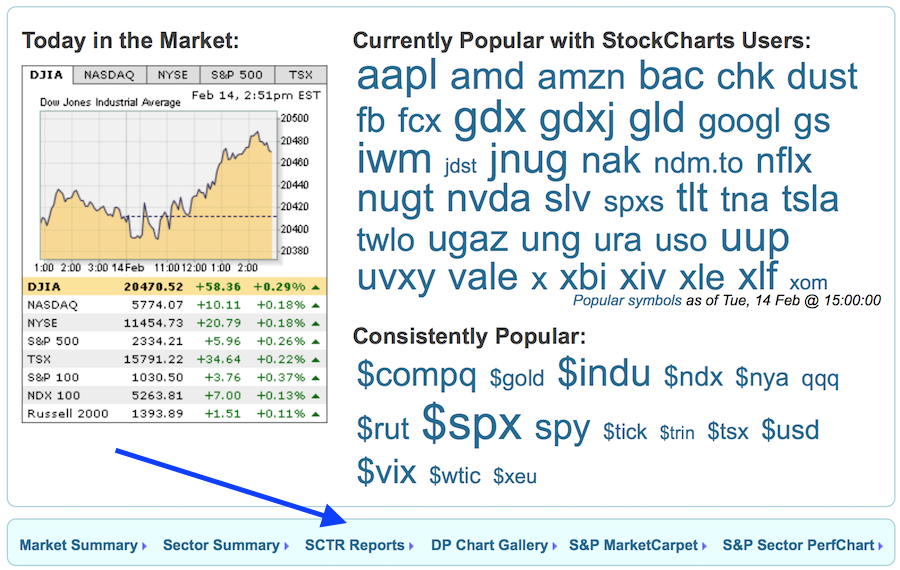 Notice the boxes show the top 10. Click on the tabs for the Top 10, top movers of the day, Bottom 10 etc. There is also a link to the full listings when you click on the SCTR link where the arrow is pointing. Notice BAC on the Large-Cap SCTR's and the KBE Bank ETF is a top 10.
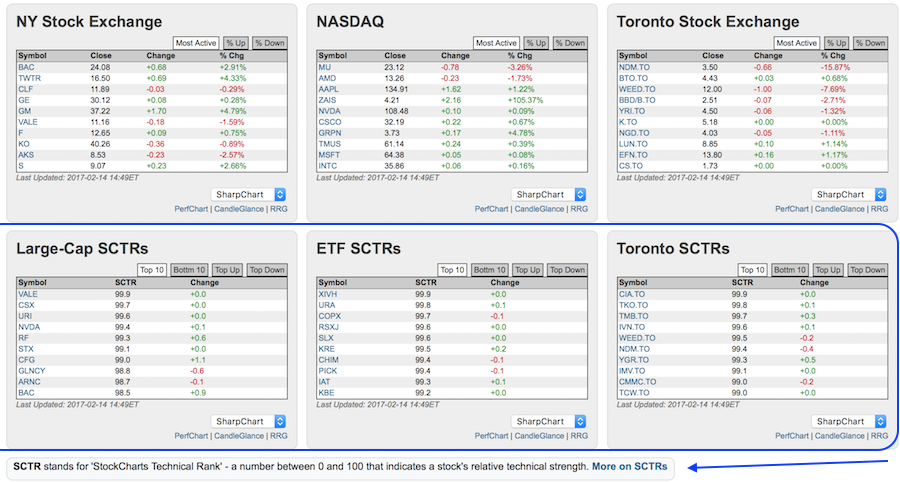
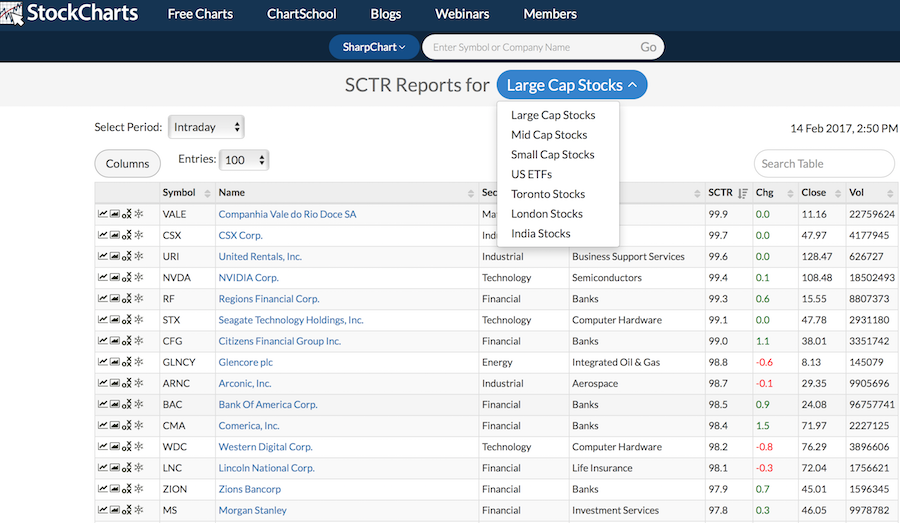
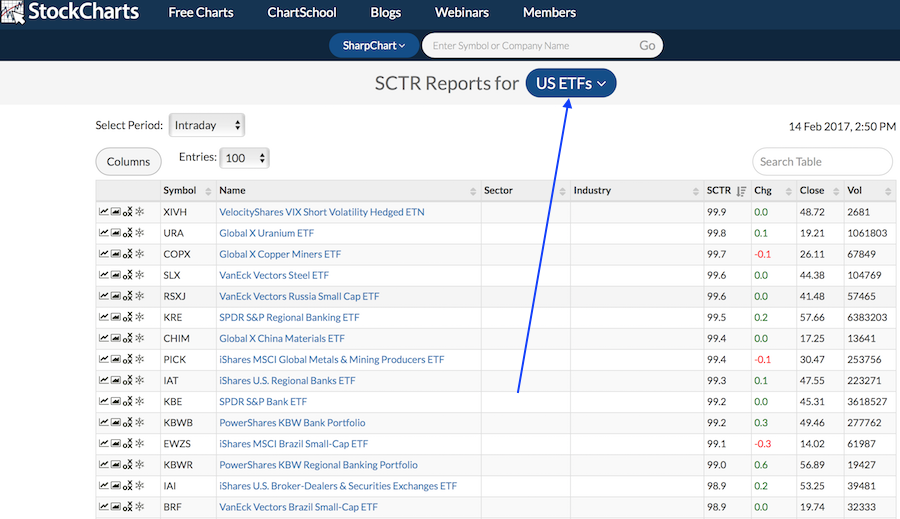
The two arrows on the pictures above show you the links to go to the full listings. Notice the drop down menu to help you work with different groupings. One of the strengths of the SCTR model created by StockCharts.com is the smaller groups enabling investors to work in groups to which they are familiar or to help diversify across different market cap sizes. In this long list, you can see how strong BAC is compared to all the other large caps and they are listed in price strength order.
 An especially important group in this drop down is the ETF group. Understanding which industry groups are leading can best be determined by the SCTR rankings. Watching for changes in these groups can also help you stay with the strong industry groups. KRE,KBE, KBWB,KBWR are all shown near the top.
 The Top 10 information for ETF's is on the home page in one of the boxes I showed earlier. Notice in the bottom right hand corner are the three ways to display all 10 charts at the same time. Note KRE and KBE.
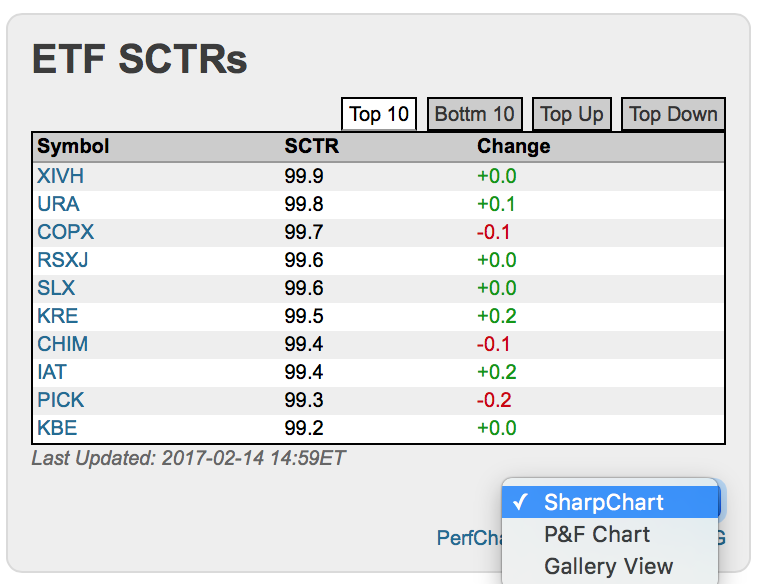
 Using the dropdown menu allows you to get a different view of an individual stock when you click on it after changing the settings. For members, you can set up different chartstylesso when you click on these, the chart to go to uses styles that you may like better than the StockCharts.com default. Members quickly realize the value of the site as the tools are set up to help them find great stocks and make money in these by using indicators they like.
 The FreeCharts tab also has a link to the SCTR full reports for members.
 On the blue line that goes across the home page, there is also a link beside the SCTR tab called Sector Summary.
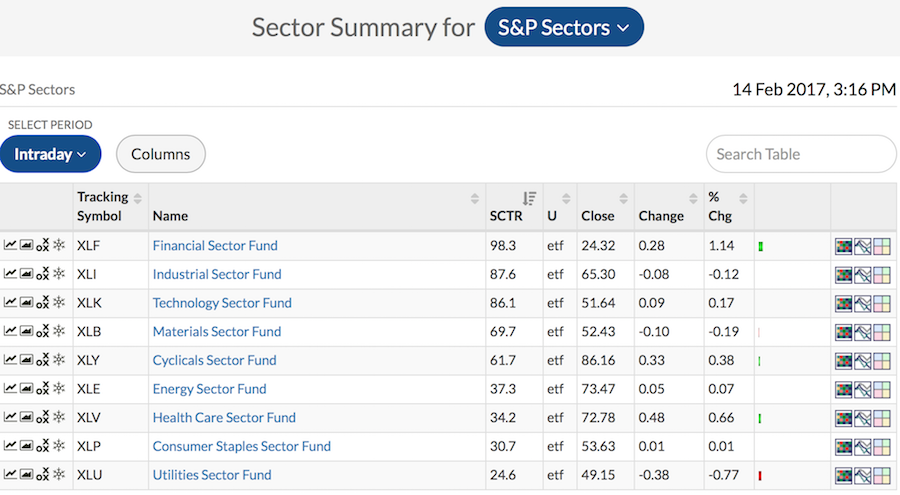
 That will give you a quick update on the strongest sectors in the market sorting by SCTR by clicking the SCTR column header. Once again we see financials as the strongest sector.
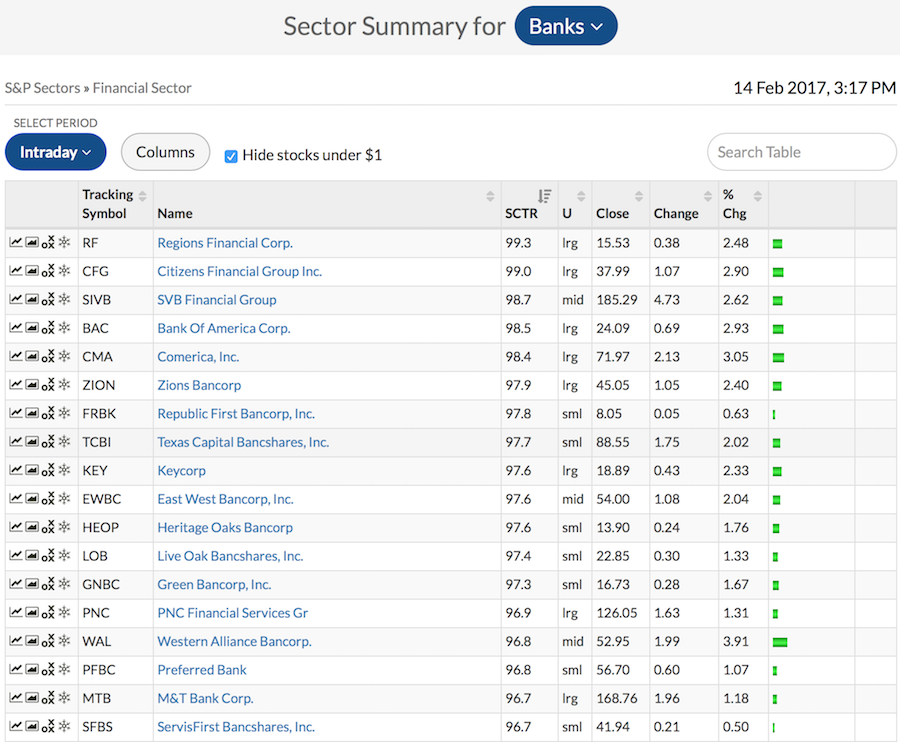
 Because you can't buy the Dow Jones Industry group, when you click through to see the industries within each sector, they do not have an SCTR ranking shown. However, when you click through Financials, to the industry page and then click through to Banks industry group which you can find by sorting on change over a 1 month period as an example, you see all of the stocks with SCTR's to help you find the strong ones. You have to click on the SCTR to sort by the SCTR column. BAC is one of the best banks in the industry group.
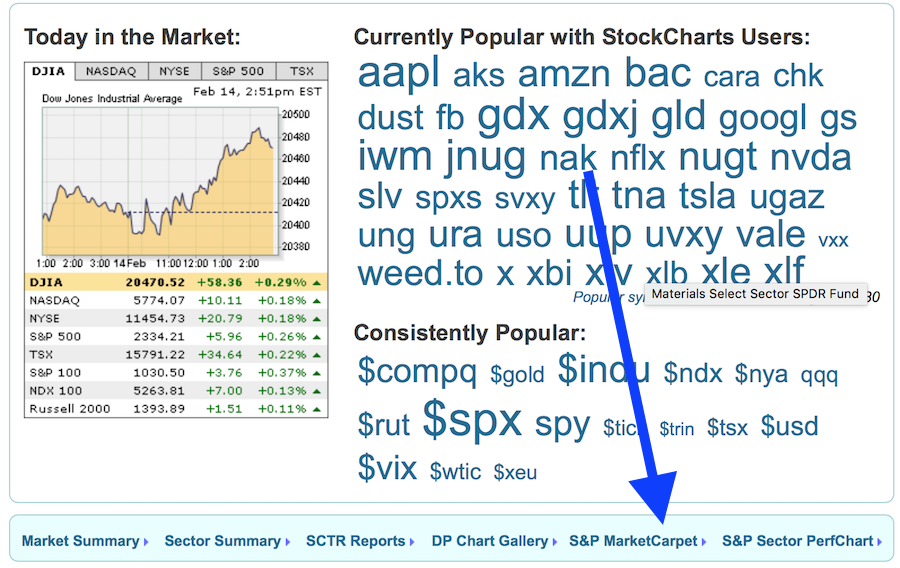
 You can also follow the Market Carpet into the SCTR realm. Some real power hiding here.
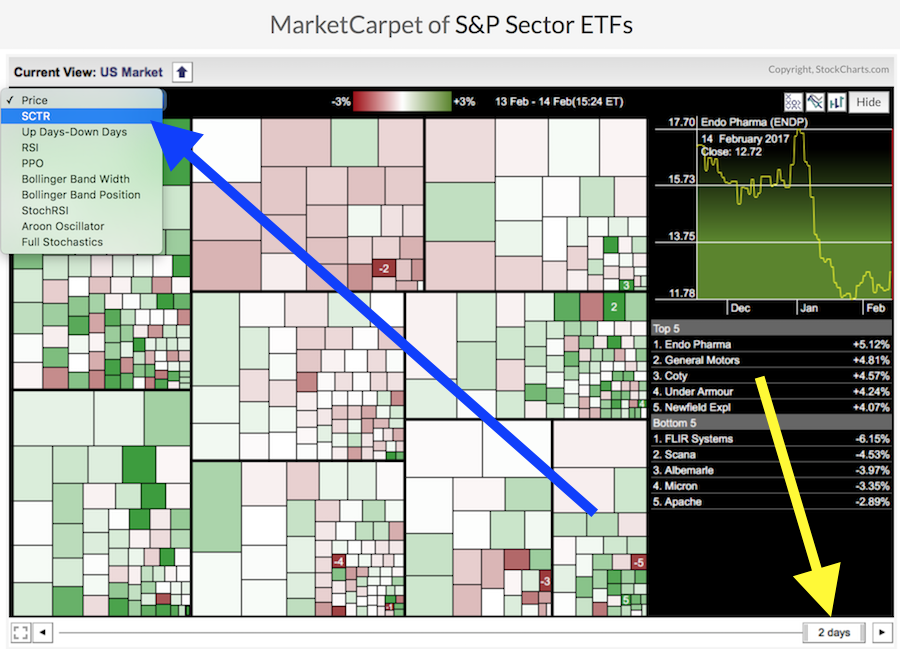
 You will see this screen. There is a drop down menu that includes SCTR. There is a slider along the bottom that can show you the changes in SCTR ranking over a different number of days.
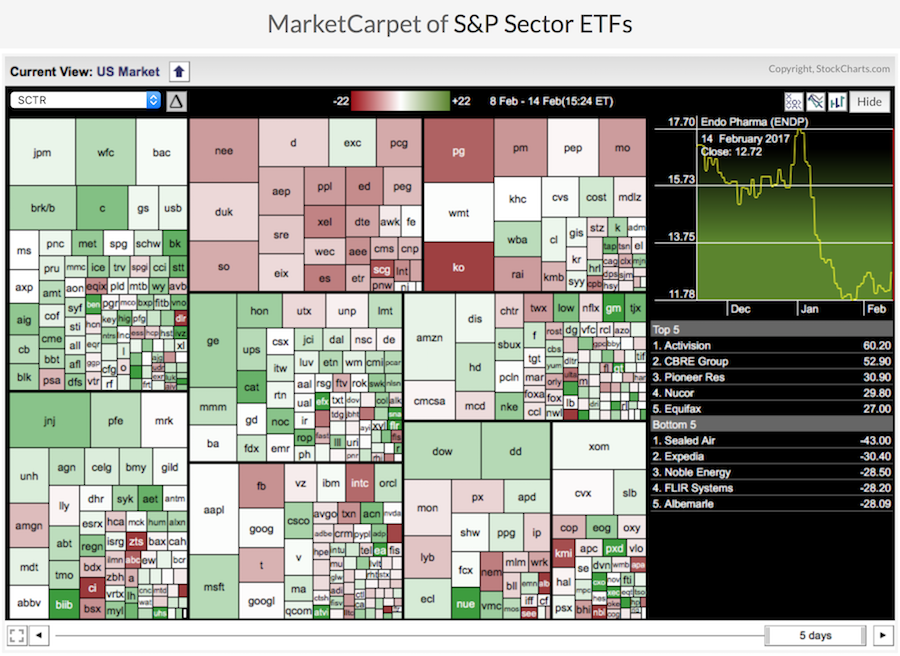
 Also, you can right click anywhere on the boxes and a menu comes up. You can select Show Ticker Symbols and it will populate the boxes. Here I have changed the slider to show the 5 day change in SCTR. Because the SCTR for BAC has not changed much this does not show as positively. However, BAC is pinned near the top of all the rankings I have shown this far. This market carpet allows you to find the fastest improving and fastest falling SCTR's.
 StockCharts.com has covered the website with some of the strongest data you can use to find great stocks. Members get full access, visitors don't get to see the full listings. What could you be waiting for? Better ideas? This is just one great one within StockCharts. Click here to take a 10 day free trial of all StockCharts.com has to offer. We hope you'll agree that we provide some of the most compelling tools in the market at a very low cost for members.
Good trading,
Greg Schnell, CMT, MFTA.