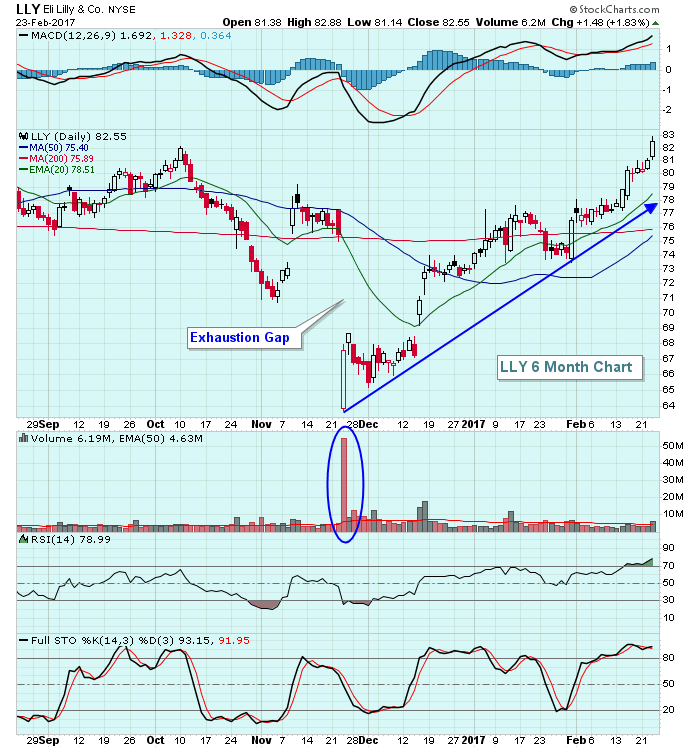
Eli Lilly (LLY) printed an exhaustion gap in November on massive volume, marking a significant bottom and over recent trading days broke a downtrend line that spanned 18 months of action. Based on this combination and improving momentum, it certainly appears that LLY has seen its worst and has begun to experience much better technical action. Check out the exhaustion gap on the daily chart:
 The short-term picture has certainly improved, but more importantly it appears as if the longer-term downtrend on the weekly chart has broken. Take a look....
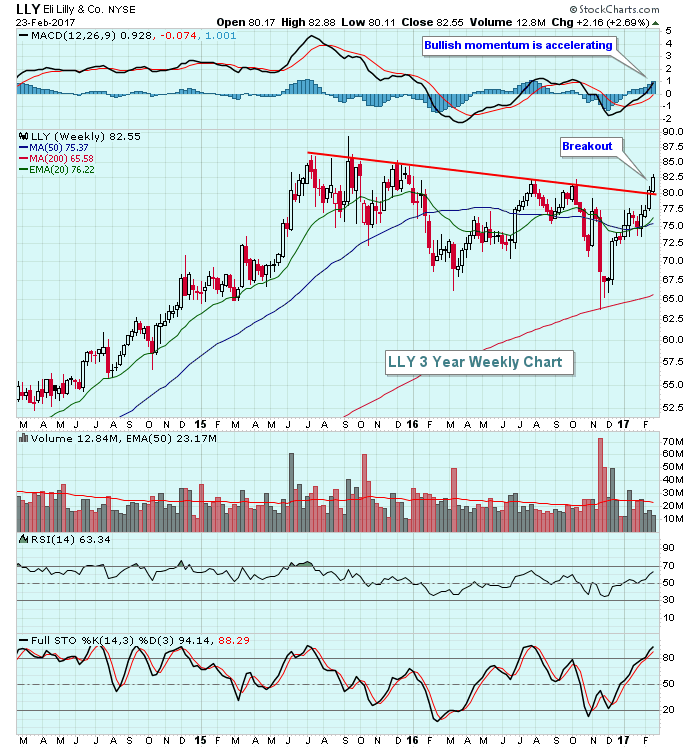 The only downside at this point is that LLY is overbought in the very near-term. So we can expect a little profit taking. Outside of that, however, LLY appears poised to sustain a run to the upside.
Happy trading!
Tom
