I spent the webinar discussing the Canadian sectors as well as working with parabolic surges.
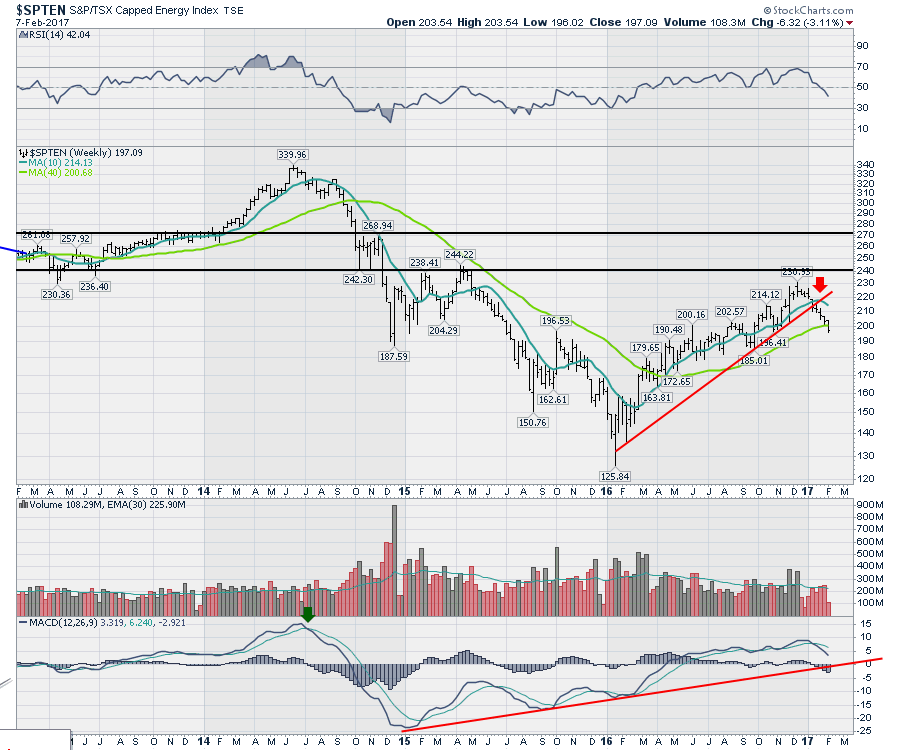
The Energy chart is broken. The real question is does it get support here around the 40 WMA?
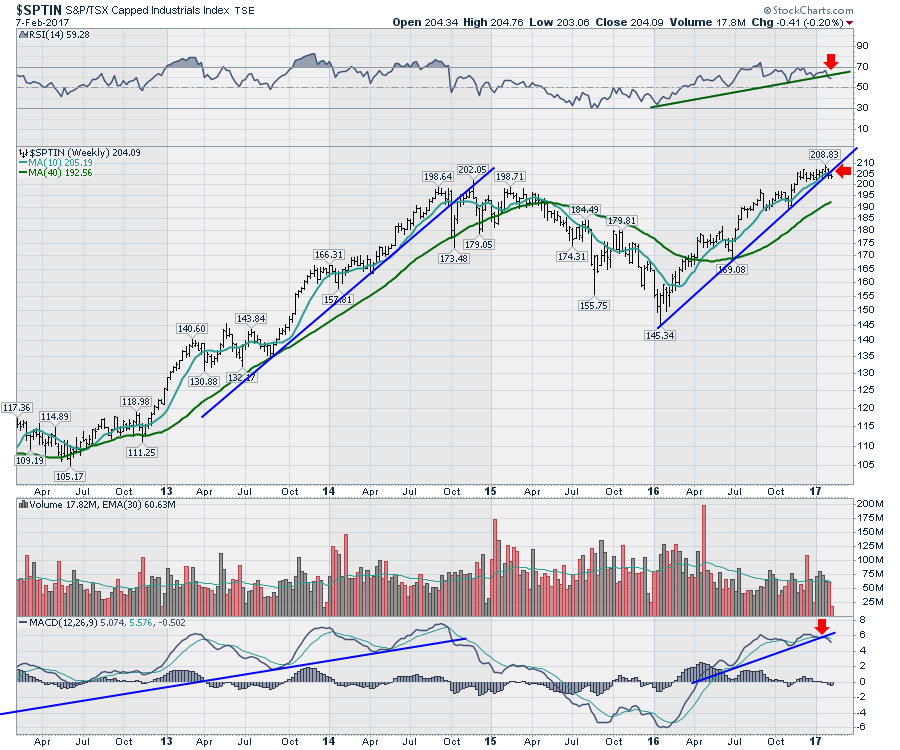
The Canadian Industrials are still trying to hold their trend line. The chart is on shaky ground this week.
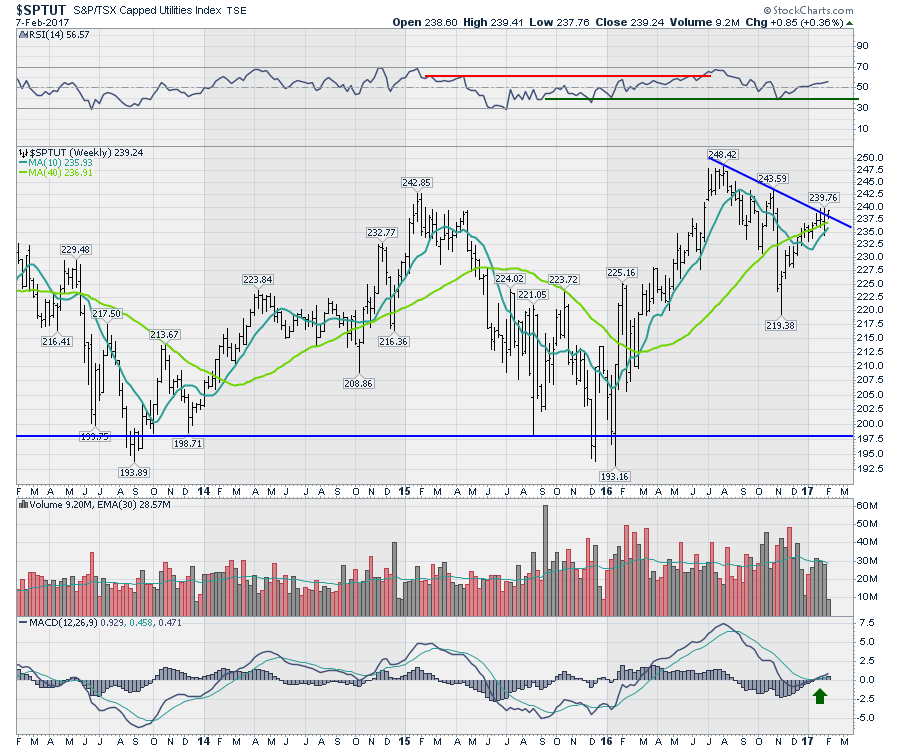
Utilities are doing just the opposite.
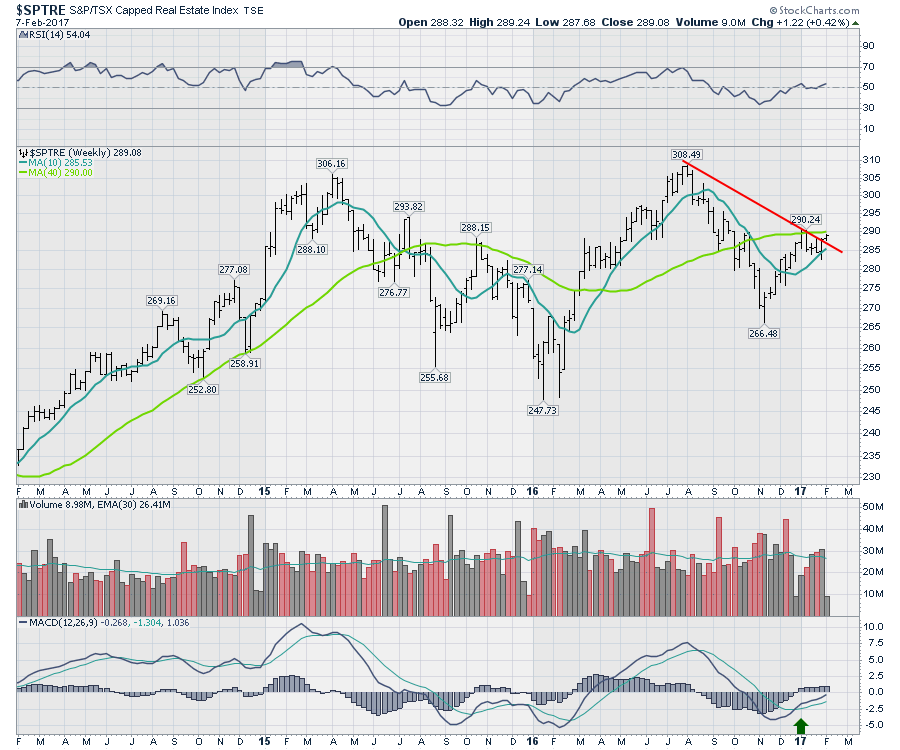
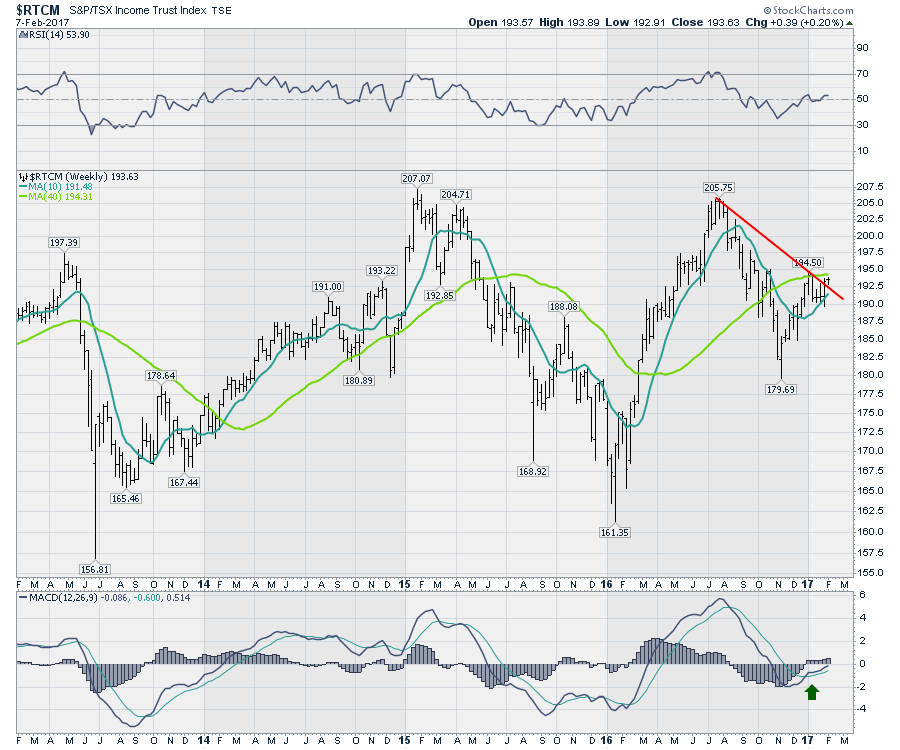
 Real Estate and Income Trusts are also breaking out.
 Here is the Income Trust chart.
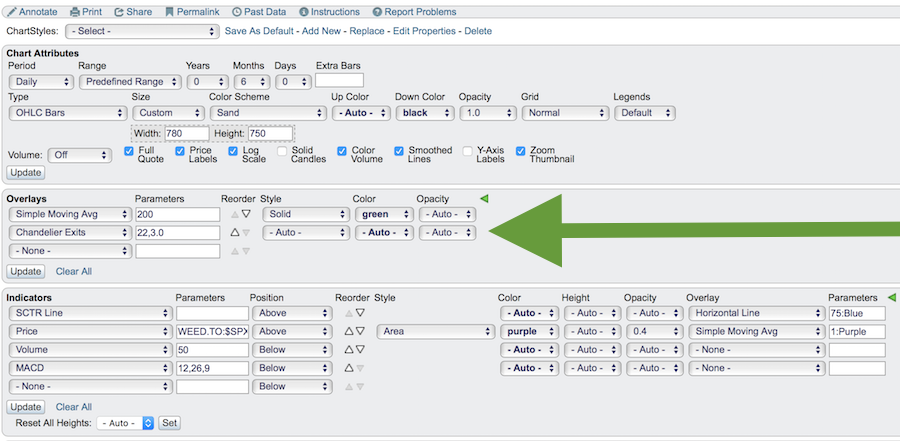
 A major portion of the webinar was spent on the parabolic charts of the Marijuana stocks. The chart below is an example of the chandelier stop feature on StockCharts.com. Parabolic charts are notoriously hard for traders and this chart feature helps investors take the emotion out of the exit.
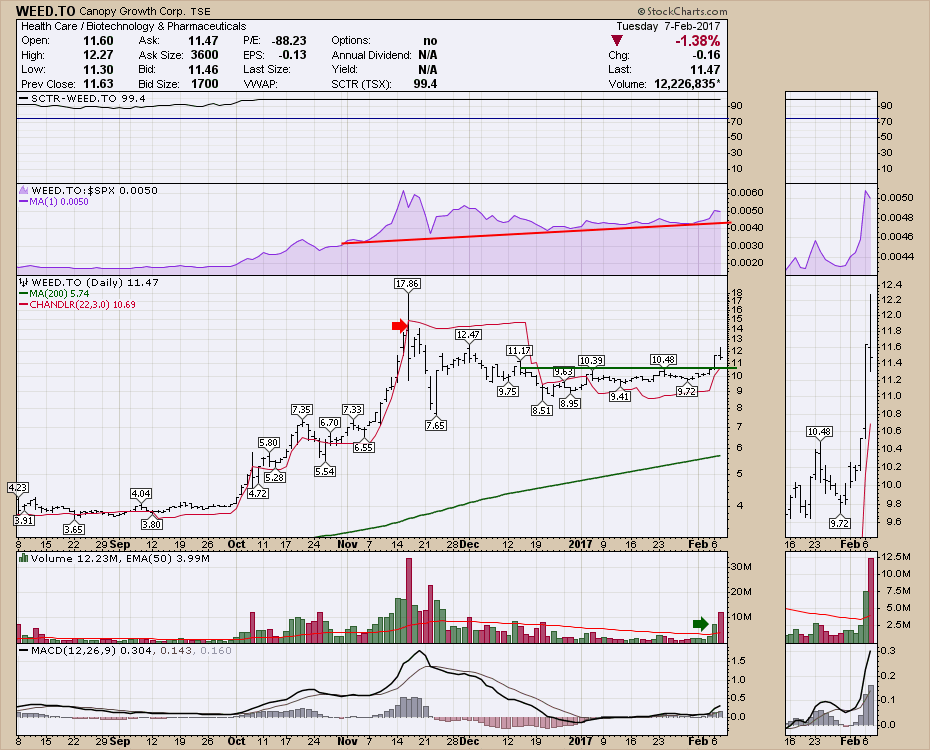 It is a very simple chart overlay. Members can set this line up as a default on their own chartstyle or they can have a separate chartstyle for stocks they own. This is another feature for helping members use technicals to invest. Click here for more information on becoming a member. Use the coupon code BESTCHARTS to get 50% off.
 Here is link to the webinar.
The Canadian Technician LIVE! with Greg Schnell - 2017-02-07 17:00 from StockCharts.com on Vimeo.
There is a lot more information on the webinar and the post-webinar survey suggested there was a lot of helpful content.
Tom Bowley and I are presenting a special live market outlook webinar on Saturday at 11 ET. This will be a members only event with some insights onto different areas of the market that you might be interested in. These are hugely attended and we hope to present you with some great trade ideas. Here is the link to register for the webinar. StockCharts Exclusive webinar for members. If you are not a member and would like to join the webinar, click here to check out the 10 day free trial with a code of BESTCHARTS. This will get you access to the webinar.
Good trading,
Greg Schnell, CMT, MFTA.