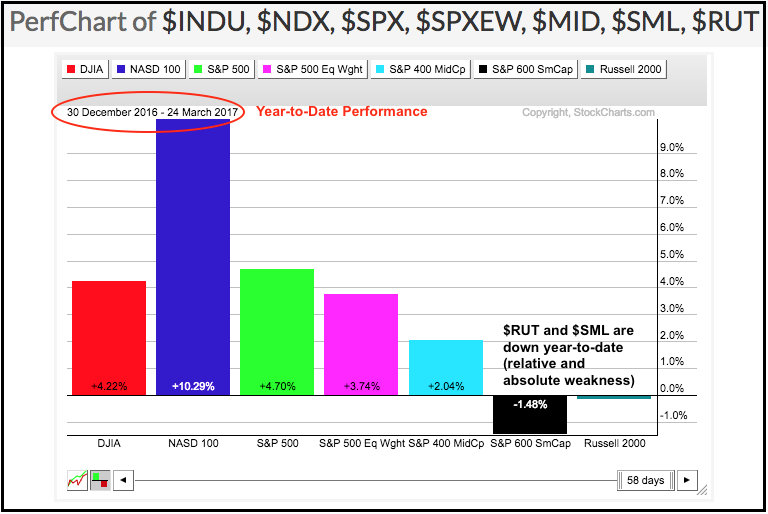
Small-caps are still leading the market since early November, but they are lagging in 2017 as year-to-date performance turned negative. The PerfChart below shows year-to-date performance for seven major stock indexes. The Nasdaq 100 is up around 10% and leading the pack by a wide margin. The Dow Industrials, S&P 500, S&P 500 Equal-Weight Index and S&P MidCap 400 are positive year-to-date, but up significantly less than the Nasdaq 100. The Achilles heel of the market is clear when we look at the S&P Small-Cap 600 and Russell 2000, which are now negative year-to-date. We are almost three months into 2017 and these two small-cap indexes have nothing to show.
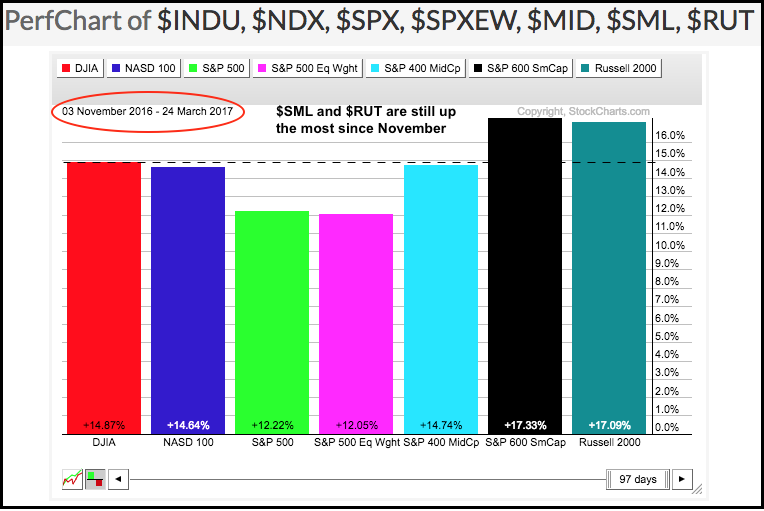
Despite relative weakness in 2017, the S&P Small-Cap 600 and Russell 2000 are still up more than the other indexes over the last 100 days (31-Oct to 24-Mar). Notice that $SML, $RUT and $INDU are up over 13.5% since November. Even so, absolute weakness in 2017 is a concern going forward because it reflects a risk-aversion within the stock market.
****************************************
Thanks for tuning in and have a great day!
--Arthur Hill CMT
Plan your Trade and Trade your Plan
*****************************************