The Rare Earth Metals ETF (REMX) had glory days from October to February. Then a slide ensued where a lot of the basic materials were falling down. Today the REMX ETF looks interesting as the chart has a new pattern of higher lows and higher highs with todays upside push. It is back above the 200 DMA and trying to break above the 50 DMA. The downtrend in Relative Strength has been broken and it is trying to make new 1-month relative strengh highs.
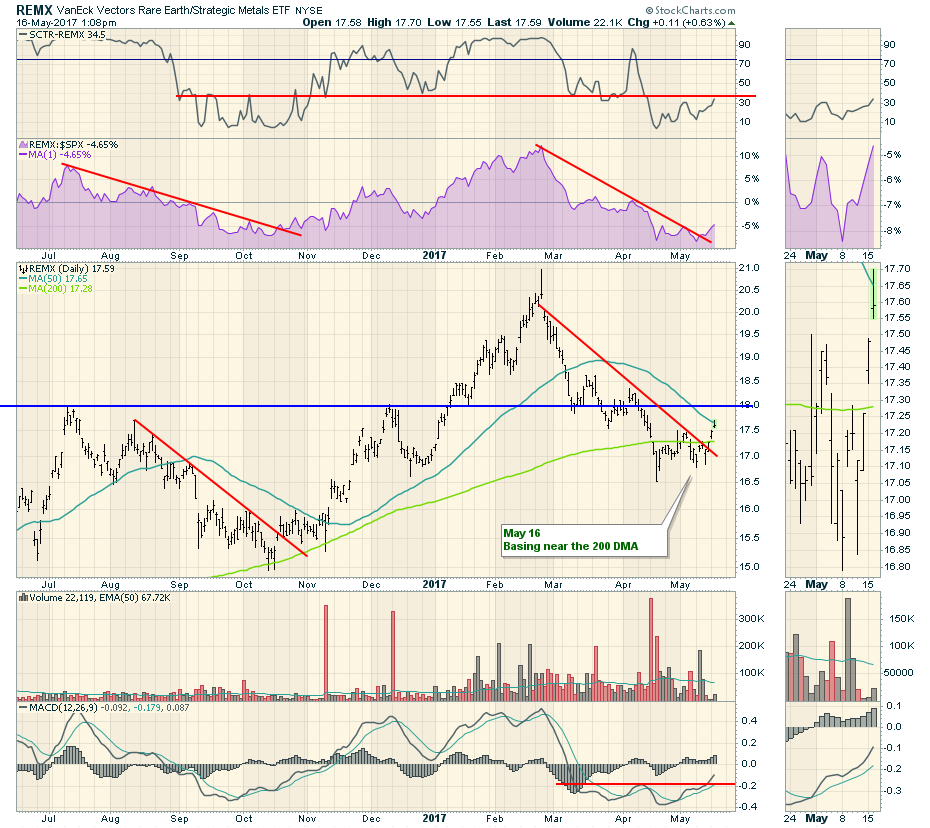
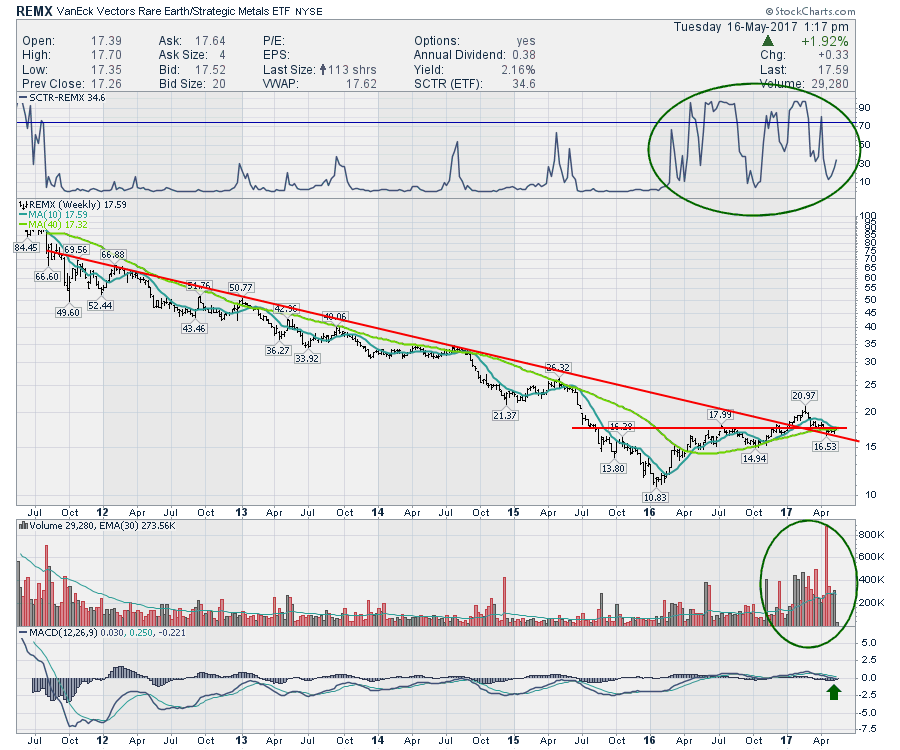
Looking on the weekly, it is also very timely. After a major downtrend, the stock recently broke through and is now pulling back to test the downtrend. There is also the horizontal support/resistance line at $18 which shows up clearly on the daily chart above as well as the weekly below.
With the Hang Seng chart starting to outperform, and a large part of the emerging market countries starting to move higher and outperform the $SPX, this would usually indicate a move towards basic materials. While this move towards basic materials has not happened yet, this is definitely a great place to identify the possibility if it is starting now.
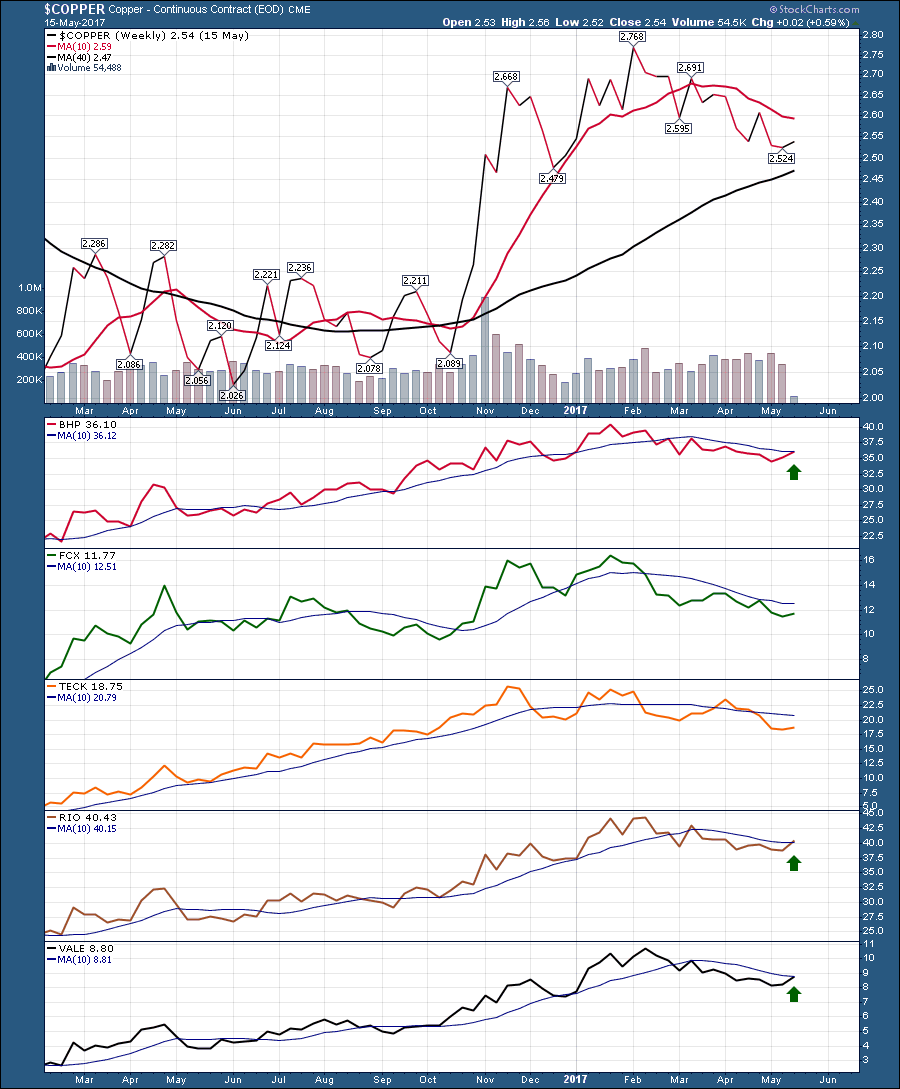
Lastly a chart of Copper and some related miners shows some interesting developments. Just this week, three of the 5 major miners have turned higher and are trying to get back above the 10 WMA. We can see Copper has had an orderly pullback so far. The chart below is weekly and Tuesday is not a weekly close, but investors looking for a new theme may be interested to see all these mining stocks starting to turn higher for the first time. Keep your eye on this one heading into Friday close to see if we get a decisive signal.
 If basic materials are starting to turn higher, this is a good place to watch for leadership.
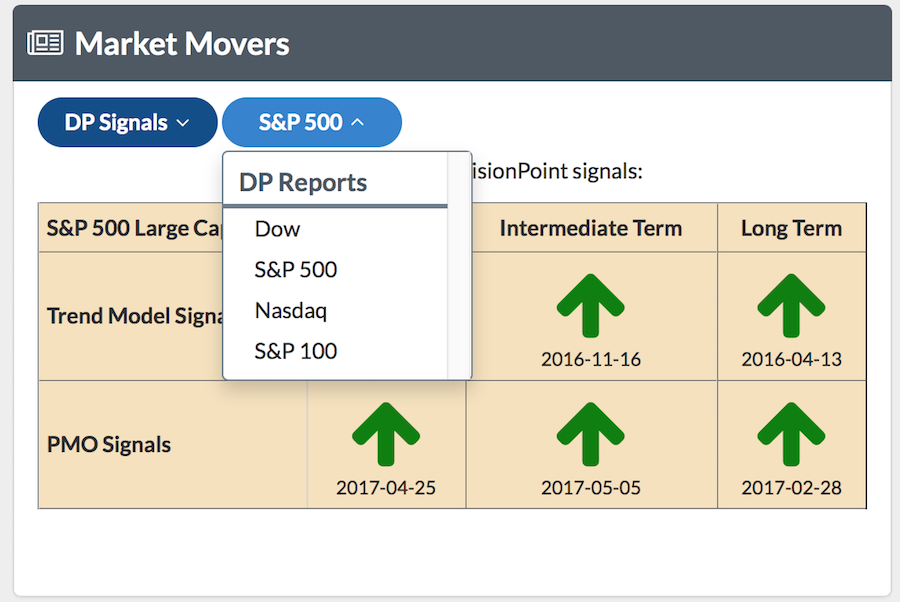
For the educational segment, the Decision Point Trend indicators are quickly available on the new Member's page. This is just a simple quick indicator to help you position yourself on the right side of the market. It is very handy to have this as a dropdown item. I would encourage you to look weekly.
 Good trading,
Greg Schnell, CMT, MFTA