The long bond is an emotional beast. There has been lots of discussion about how the long bond price should be falling through the floor with the Fed raising rates. The TLT ETF represents the 20 + Year (Long) bonds. Today marks an interesting test of the 200 DMA from the bottom side. The 200 DMA has been an area of friction before.
The SCTR is perking up from being one of the worst ETF's in the market to moving out of the basement now. Interestingly, an SCTR above 30 has been associated with uptrends. While the Relative Strength has not started to make higher highs, it wouldn't take much to get to 6-month highs.
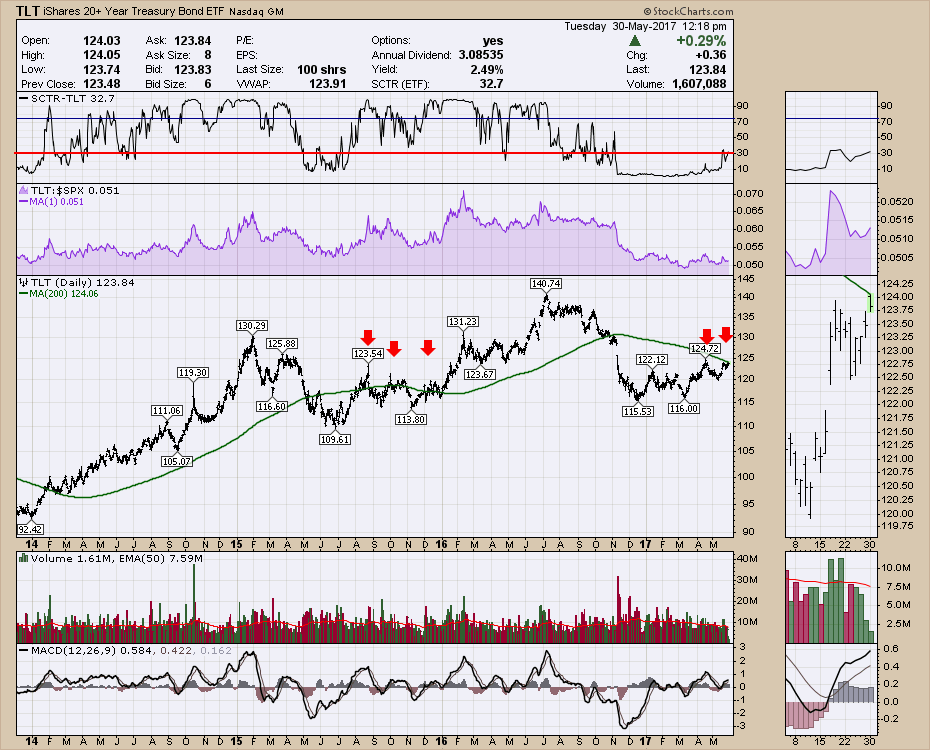
The MACD continues to look more like an uptrend in development, with the MACD spending its time above zero lately. The MACD above zero associated with the big uptrends on the price chart.
The one phenomena on the chart that should be watched closely is that the end of June marked inflection points the last two years. Three years ago, June marked the end of a sideways consolidation and a fertile bull run ensued.
There is a Fed meeting date mid June where interest rates are expected to go higher which would suggest this chart will come under pressure. However, with all of these factors in play, the TLT looks bullish with rising lows and higher highs. Watch closely to see if it can power through the 200 DMA here.
If you are interested in the Commodities picture, I recorded a webinar on Thursday discussing Oil, Gold, Steel and Copper. You can see it on the vimeo channel, Greg Schnell. If you would like to be updated when I add new videos, click the gray 'Follow' button on the right. There is also an HD button that makes the picture a lot clearer.
If you have not asked for article notifications in your email, you can find and click on the Notify Me button at the bottom of each blog. I write on the Don't Ignore This Chart commentary, The Commodities Countdown commentary, The Canadian Technician commentary and Chartwatchers. Thanks for following along.
Good trading,
Greg Schnell, CMT, MFTA