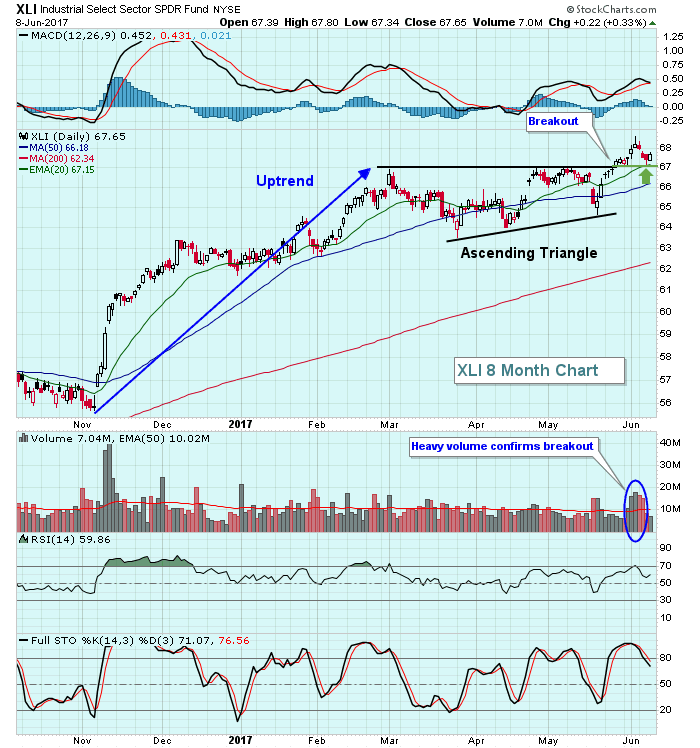
Over the past week, it's been about an even split among sectors in terms of winners and losers. Industrials (XLI) is one sector that's been slightly lower over the past week, but technically things still look very bright in this space. Broken price resistance generally becomes solid price support - that's TA 101. In the case of the XLI, broken price resistance also was the top of a very bullish ascending triangle pattern as you can see below:
 After the XLI rose well above 68, we saw it pull back to test not only price/triangle support, but also its rising 20 day EMA, which is currently at 67.15. Volume accelerated on the triangle breakout which, in my opinion, helps to confirm the pattern. Now that the back test is complete, I'd look for absolute and relative strength from industrials.
Happy trading!
Tom
