 Once a quarter, I update my Tensile Trading ChartPack. With such a large number of users now it was easy to poll some of these investors to ask how and why they use the ChartPack. Their reasons were enlightening, so I’m summarizing a few of their comments in this week’s blog.
Simplifies the Markets: The ChartPack captures the massiveness of the whole market and organizes it into a manageable number of ChartLists.
A Professional’s Own Organizational Tool Kit: It’s like the only tool kit personally used by a veteran money manager everyday for decades that’s available to the public. The 100% transparency allows for it to be used in part or as a whole – however investors wish.
Maximizes Your Efficiency: Its structure facilitates the relative strength approach of market / sector / industry / stock focus, allowing investors to find the highest probability trades that the market has to offer in the shortest amount of time.
Heavy Lifting Done for You: This organizational tool kit represents over 1,000 man-hours of effort. It contains over 90 ChartLists strategically prepopulated with the most appropriate indexes, ETFs and equities and then preformatted with the best indicators.
Feedback: With an extensive global user base, the network of investors suggesting ongoing enhancements ensures continual betterment of the ChartPack.
Personalized Portfolio Design: ChartList #10.07 is prepopulated with an assortment of 59 different asset classes, each represented by an appropriate ETF that creates a virtual buffet from which investors can expertly build a personalized asset allocation profile.
Focused Lens: The organizational paradigm of the Tensile Trading ChartPack facilitates all aspects of profitable stalking, buying, monitoring and selling of your positions.
Regular Tradeable Ideas: Four free updates and upgrades are included each year to coincide with the 40 Fidelity Sector Funds releasing their latest holdings. The ChartList highlights Fidelity’s latest buys and sells, and it incorporates them into ChartLists, thereby empowering investors with virtual X-ray vision into the latest trades by one of the world’s largest institutional money managers.
Total Transparency: The FREE 60-minute video recorded at ChartCon 2014 provides detailed insights as to how best to use the ChartPack. Coupled with the Tensile Trading six-hour seminar DVD, investors can jumpstart their trading efforts while building on a proven foundation and sound organization without the confusion and messiness often experienced by new investors.
DO NOT OVERLOOK THIS BENEFIT: Many ChartLists have unique insights, comments and descriptions attached which may be viewed in four different formats: 10-per-page, chartbook, gallery or the edit format. Don’t ignore this valuable resource that’s evolved in part from the contributions of many ChartPack users.
UPDATE: Correlations Matter Amongst Asset Classes
Last quarter, I added ChartList 10.07 which is prepopulated with the essential 59 asset classes from which investors can build a diversified personal asset allocation profile. The ChartList not only contains 59 different asset classes, but it also has charts for the most popular and widely traded ETFs that are most appropriate for each of the classes.
As I’ve written in previous blogs, investors have wrongly assumed that if they bought an international all-world ETF (such as VT) and the S&P 500 (SPY), they would achieve diversification. The sad truth is that the correlation between VT and SPY is a whopping .95, resulting in virtually NO diversification.
The exciting enhancement for this quarter’s ChartPack is that I’ve calculated the correlations of all 59 assets to the S&P 500 (SPY) and I’ve entered those values in the notes beneath each chart. Because some of the most widely traded ETFs do not yet have a full five years of data, the calculations are based on three years of data as of July 23, 2015. I guarantee that these correlations will be eye-openers for many investors. They range from a nearly perfect correlation of 0.99 for some asset classes all the way down to an inverse correlation of negative 0.27 – and everything in between. So pick your asset classes with care!
UPDATE: Interest Rates –
What Insiders Charge Each Other and Why It Matters for You
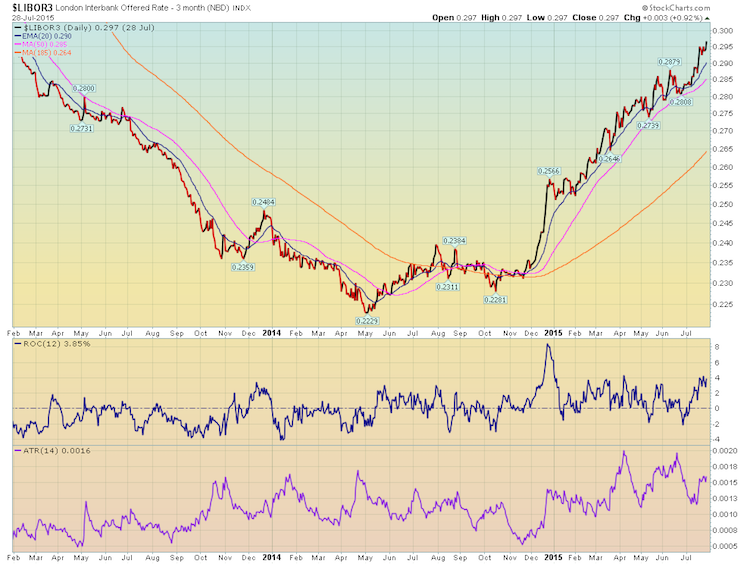
In the Bonds ChartList (#220), I have added a chart of the three-month LIBOR interest rate. The London Interbank Offered Rate (LIBOR) is the average interest rate that leading banks charge each other when borrowing from one another. It’s based on actual inter-bank market transactions, and as the title implies, it’s the rate insiders actually charge insiders. Its trend, therefore, provides us individual investors with a peek into what these large financial insiders believe will be the direction of future interest rates.
Here is why I like it. LIBOR is calculated in five currencies and is published by Reuters at 11:00 AM everyday. Since $530 trillion in derivatives and financial products are tied to LIBOR, it tends to be the first step in calculating their own interest rates for financial institutions, mortgage lenders and credit card agencies. In other words, investors should pay attention!
UPDATE: Sector ETF Myth-Buster
The top equity holdings in the nine S&P Sector Spyders never change. WRONG!! They are more fluid than you would think. This quarter, Technology (XLK), Healthcare (XLV) and Consumer Discretionary (XLY) had additions and deletions to the compositions of their top holdings.
Remember that by tracking the individual equities in your favorite sector ETF, you are in essence endowed with X-ray vision as to what’s going on inside that sector. Checkout the charts in ChartList 401 through 409 and you’ll see specifically what I mean.
UPDATE: Fidelity Select Sector Funds New Buys & Sells
Some of you have mentioned to me that new stock buys, in some cases, are equities that do not logically fit into the particular Fidelity sector fund for which it is labeled. Read this carefully because what I am about to describe often affects other Mutual Funds as well.
Fidelity Select Sector managers are permitted to purchase up to 20% of their portfolios outside of their benchmark sector and industry groups. If I were a manager, I would definitely want to take advantage of this opening because it would increase the probability that I would outperform my sector / industry benchmark – hopefully leading to kudos and an extra bonus from the boss! In fact, to Fidelity’s credit, an internal study revealed that over the past decade, a healthy majority of Fidelity Sector Fund managers did indeed outperform their benchmarks.
On the surface, everyone wins. But on the other hand, if you are a focused investor and want to bet on the automotive sector by buying Fidelity Automotive (FSAVX) and hypothetically the fund manager bought Gilead Sciences in an attempt to outperform his auto industry benchmark, you might be upset because you already own a big position in Gilead. Of course, if this biotech stock rocketed upwards, all would be forgiven. Likewise, these managers are also allowed to invest up to 20% of their portfolio internationally, so these efforts, too, may have a positive or negative impact.
SUMMARY:
I’m particularly pleased this quarter with the overall direction that we have taken this ChartPack. I am grateful to our extensive network of users and appreciate hearing from you all about suggestions, enhancements and improvements. Keep them coming!
Trade well; trade with discipline!
-- Gatis Roze
UPGRADE INSTRUCTIONS FOR EXISTING CHARTPACK USERS:
Important: If you have modified any of the charts in any of the ChartLists that start with “GR - ”, those changes will be deleted as part of the upgrade process. If you want to keep those changes, you need to copy those charts into a different non-"GR" ChartList before you upgrade!
To Upgrade the Tensile Trading ChartPack, follow these steps:
1. Log in to your account and then click on the "Your Account" link in the upper right corner of the web page.
2. Scroll down and find the "ChartPacks" area towards the bottom of that page.
3. Find the entry for the "Tensile Trading" ChartPack in the table that appears. (If you don't see it, that means that you didn't purchase it - click here to purchase it.)
4. Click on the "Re-Install" button next to the Tensile Trading ChartPack to start the reinstall process.
The download should take about 15 seconds. At that point, you can explore the new ChartLists and updates.
INSTALLATION INSTRUCTIONS FOR NEW CHARTPACK USERS:
If you are new and would like to add the Tensile Trading ChartPack to your StockCharts account, please Click HERE to get started.
P.S. Click HERE for information on my future appearances & seminars.
October 17th, 2015- ASSET ALLOCATION WORKSHOP with Gatis Roze & Chip Anderson.
P.P.S. For both convenience & consistency, please click on the "Email updates" link near the upper right corner of this page to automatically receive my blog once a week as soon as it comes out.